Holiday Inn 2013 Annual Report Download - page 12
Download and view the complete annual report
Please find page 12 of the 2013 Holiday Inn annual report below. You can navigate through the pages in the report by either clicking on the pages listed below, or by using the keyword search tool below to find specific information within the annual report.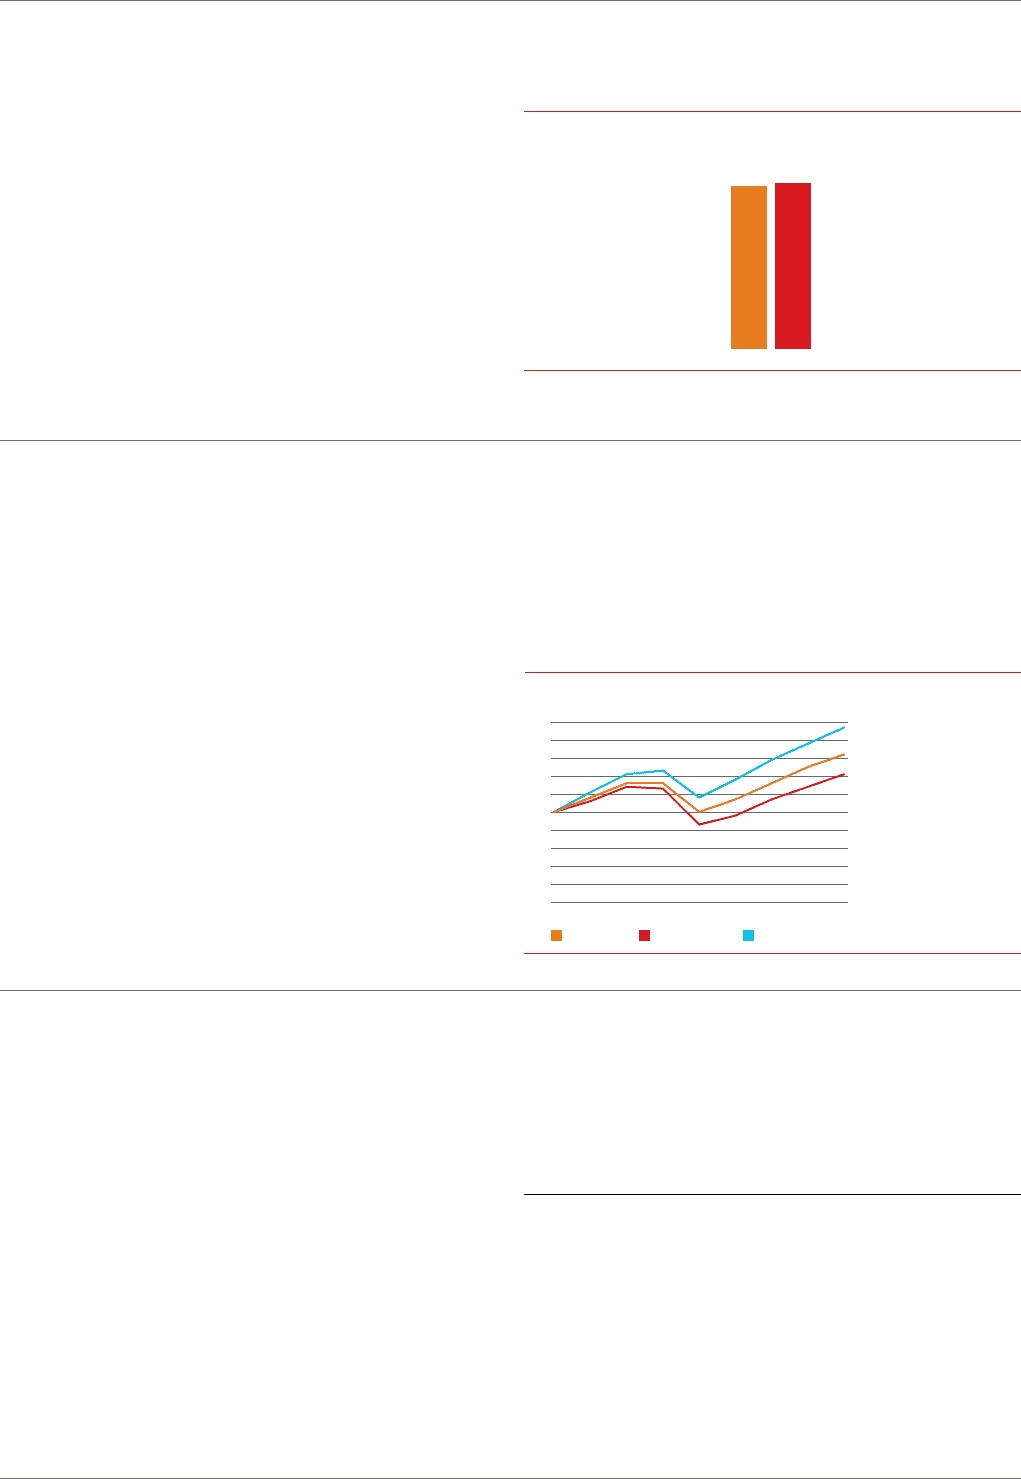
Where the industry is now
The global hotel industry
The global hotel industry comprises approximately 14.6 million
rooms, according to Smith Travel Research, and these are broadly
segmented into branded (multiple hotels under the same brand
name) and independent (non-branded) hotels. Growth in demand
is driven by economic growth and an increasing trend for domestic
and global travel resulting in part from favourable demographics
and globalisation of travel.
There are a number of key industry metrics which are widely
recognised and used to track performance. These include revenue
per available room (RevPAR), average daily rate and rooms supply
growth. These are amongst the key performance measures actively
monitored by IHG. IHG also monitors macroeconomic indicators
such as gross domestic product (GDP) trends, which is a leading
indicator in hotel industry trends.
The branded hotel market
Smith Travel Research estimates that the branded hotel market
accounts for 51.5% of the total hotel market. However, this market
is fragmented in terms of key brand players with the top five
branded hotel companies (of which IHG is one) accounting for only
41% of the total branded hotel market in terms of open rooms and
72% of the development pipeline (hotels in planning and under
construction but not yet open). However, as can be seen in the
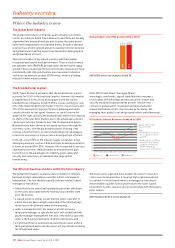
graph on the right, globally, the branded hotel market is increasing
its share of the total hotel market, due to the advantages a brand
can bring to hotel performance over that of independent hotels.
Branded hotels have shown an increased resilience through the
economic cycles, with the big branded players showing clear
revenue outperformance, as well as benefiting from advantages
in terms of economies of scale across a broad portfolio of hotels.
In the US, around 70% of the industry supply is branded. In fast
developing markets, such as China and India, branded penetration
is lower, at around 20 to 30%. However, this is expected to increase
significantly over the coming decades as branded hotels gain
traction due to the advantages of reliability, guest safety and
security and consistency of standards that large global
brandsbring.
The different business models within the hotel industry
The global hotel industry operates under a number of different
business models, depending on whether a hotel is branded or
independent. The four models typically seen are owned, leased,
managed or franchised:
• Owned hotels are owned and operated by an owner who bears
all the costs associated with the hotel but also benefits from
all of the income;
• a leased model is similar, except that the owner-operator of
a hotel does not have outright ownership of the hotel but pays
rental fees to the ultimate owner of the property;
• under a managed model, the owner of a hotel will use a
third-party manager to operate the hotel on its behalf and will
pay the manager management fees and, if the hotel is operated
under a third-party brand name, brand licensing fees; and
• a franchised hotel is owned and operated by an owner under a
third-party brand name and the owner will pay a brand licensing
fee to the brand owner.
Whilst an owner-operated hotel enables the owner to have full
control over hotel operation, it requires high capital investment.
In contrast, for hotel brand owners, a managed or franchised
model enables quicker rooms growth due to the lower capital
investment, but this requires strong relationships with third-party
hotel owners.
IHG's business model is set out on page 16.
IHG’s 2014 Trends Report (see page 20 and
www.ihgplc.com/trends_report) identified that consumers
trust brands with a heritage and they value the comfort and
security established global brands provide. However the
collision of globalisation, localisation and personalisation
means that brands need to stay relevant by becoming ‘3D’ –
managing their global, local and personal assets simultaneously.
4.5%
4.4%
2012
2013
Global industry RevPAR growth (2013 v 2012)
50
60
70
80
90
100
110
120
130
140
150
2005 2006 2007 2008 2009 2010 2011 2012 2013
Industry Independents Big brands
Source: Smith Travel
Research (STR).
Note:
•Independentsarehotels
notassignedtoabrand
per STR.
•Bigbrandsareanybrand
affiliated with the parent
companyofHilton,IHG,
Marriott,Wyndham,
Choice,AccororStarwood.
US Industry Annual Revenues Indexed to 2005
IHG’s KPIs are set out on pages 38 and 39.
10 IHG Annual Report and Form 20-F 2013
Industry overview


