Holiday Inn 2013 Annual Report Download - page 133
Download and view the complete annual report
Please find page 133 of the 2013 Holiday Inn annual report below. You can navigate through the pages in the report by either clicking on the pages listed below, or by using the keyword search tool below to find specific information within the annual report.-
 1
1 -
2
-
3
-
4
-
5
-
6
-
7
-
8
-
9
-
10
-
11
-
12
-
13
-
14
-
15
-
16
-
17
-
18
-
19
-
20
-
21
-
22
-
23
-
24
-
25
-
26
-
27
-
28
-
29
-
30
-
31
-
32
-
33
-
34
-
35
-
36
-
37
-
38
-
39
-
40
-
41
-
42
-
43
-
44
-
45
-
46
-
47
-
48
-
49
-
50
-
51
-
52
-
53
-
54
-
55
-
56
-
57
-
58
-
59
-
60
-
61
-
62
-
63
-
64
-
65
-
66
-
67
-
68
-
69
-
70
-
71
-
72
-
73
-
74
-
75
-
76
-
77
-
78
-
79
-
80
-
81
-
82
-
83
-
84
-
85
-
86
-
87
-
88
-
89
-
90
-
91
-
92
-
93
-
94
-
95
-
96
-
97
-
98
-
99
-
100
-
101
-
102
-
103
-
104
-
105
-
106
-
107
-
108
-
109
-
110
-
111
-
112
-
113
-
114
-
115
-
116
-
117
-
118
-
119
-
120
-
121
-
122
-
 123
123 -
 124
124 -
 125
125 -
 126
126 -
 127
127 -
 128
128 -
 129
129 -
 130
130 -
 131
131 -
 132
132 -
 133
133 -
 134
134 -
 135
135 -
 136
136 -
 137
137 -
 138
138 -
 139
139 -
 140
140 -
 141
141 -
 142
142 -
 143
143 -
144
-
145
-
146
-
147
-
148
-
149
-
150
-
151
-
152
-
153
-
154
-
155
-
156
-
157
-
158
-
159
-
160
-
161
-
162
-
163
-
164
-
165
-
166
-
167
-
168
-
169
-
170
-
171
-
172
-
173
-
174
-
175
-
176
-
177
-
178
-
179
-
180
-
181
-
182
-
183
-
184
-
185
-
186
-
187
-
188
-
189
-
190
-
191
-
192
 |
 |
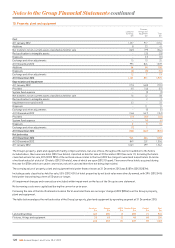
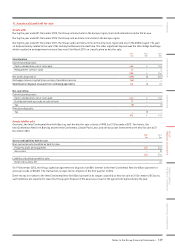
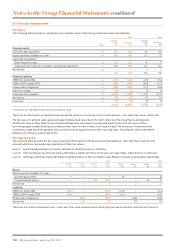
13. Intangible assets
Software
$m
Management
contracts
$m
Other
intangibles
$m
Total
$m
Cost
At 1 January 2012 252 231 138 621
Additions 70 –14 84
Reclassification from property, plant and equipment 25 – – 25
Disposals (21) –(3) (24)
Exchange and other adjustments (1) 425
At 31 December 2012 325 235 151 711
Additions 79 40 16 135
Disposals (8) –(7) (15)
Exchange and other adjustments (1) 2(1) –
At 31 December 2013 395 277 159 831
Amortisation and impairment
At 1 January 2012 (138) (116) (59) (313)
Provided (17) (10) (10) (37)
System Fund expense (9) – – (9)
Reclassification from property, plant and equipment (2) – – (2)
Disposals 2 – 3 5
Exchange and other adjustments 1 – (2) (1)
At 31 December 2012 (163) (126) (68) (357)
Provided (21) (7) (11) (39)
System Fund expense (12) – – (12)
Disposals 8–715
Exchange and other adjustments (1) 2(1) –
At 31 December 2013 (189) (131) (73) (393)
Net book value
At 31 December 2013 206 146 86 438
At 31 December 2012 162 109 83 354
At 1 January 2012 114 115 79 308
Software disposals in 2012 included an exceptional write-off of $18m resulting from a re-assessment of the ongoing value of elements of
the technology infrastructure.
Substantially all of software additions are internally developed.
Borrowing costs of $0.2m (2012 $0.3m) were capitalised during the year in respect of software projects.
The weighted average remaining amortisation period for management contracts is 24 years (2012 19 years).
Notes to the Group Financial Statements 131
OVERVIEW STRATEGIC REPORT GOVERNANCE
GROUP
FINANCIAL STATEMENTS
PARENT COMPANY
FINANCIAL STATEMENTS ADDITIONAL INFORMATION