Holiday Inn 2013 Annual Report Download - page 128
Download and view the complete annual report
Please find page 128 of the 2013 Holiday Inn annual report below. You can navigate through the pages in the report by either clicking on the pages listed below, or by using the keyword search tool below to find specific information within the annual report.-
 1
1 -
2
-
3
-
4
-
5
-
6
-
7
-
8
-
9
-
10
-
11
-
12
-
13
-
14
-
15
-
16
-
17
-
18
-
19
-
20
-
21
-
22
-
23
-
24
-
25
-
26
-
27
-
28
-
29
-
30
-
31
-
32
-
33
-
34
-
35
-
36
-
37
-
38
-
39
-
40
-
41
-
42
-
43
-
44
-
45
-
46
-
47
-
48
-
49
-
50
-
51
-
52
-
53
-
54
-
55
-
56
-
57
-
58
-
59
-
60
-
61
-
62
-
63
-
64
-
65
-
66
-
67
-
68
-
69
-
70
-
71
-
72
-
73
-
74
-
75
-
76
-
77
-
78
-
79
-
80
-
81
-
82
-
83
-
84
-
85
-
86
-
87
-
88
-
89
-
90
-
91
-
92
-
93
-
94
-
95
-
96
-
97
-
98
-
99
-
100
-
101
-
102
-
103
-
104
-
105
-
106
-
107
-
108
-
109
-
110
-
111
-
112
-
113
-
114
-
115
-
116
-
117
-
 118
118 -
 119
119 -
 120
120 -
 121
121 -
 122
122 -
 123
123 -
 124
124 -
 125
125 -
 126
126 -
 127
127 -
 128
128 -
 129
129 -
 130
130 -
 131
131 -
 132
132 -
 133
133 -
 134
134 -
 135
135 -
 136
136 -
 137
137 -
 138
138 -
139
-
140
-
141
-
142
-
143
-
144
-
145
-
146
-
147
-
148
-
149
-
150
-
151
-
152
-
153
-
154
-
155
-
156
-
157
-
158
-
159
-
160
-
161
-
162
-
163
-
164
-
165
-
166
-
167
-
168
-
169
-
170
-
171
-
172
-
173
-
174
-
175
-
176
-
177
-
178
-
179
-
180
-
181
-
182
-
183
-
184
-
185
-
186
-
187
-
188
-
189
-
190
-
191
-
192
 |
 |

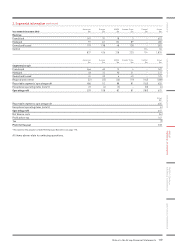
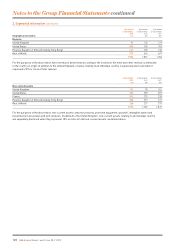
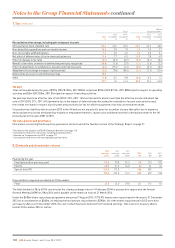
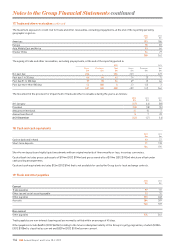
7. Tax continued
Total2
Before
exceptional items4
2013
%
2012
(restated1)
%
20113
(restated1)
%
2013
%
2012
(restated1)
%
2011
(restated1)
%
Reconciliation of tax charge, including gain on disposal of assets
UK corporation tax at standard rate 23.3 24.5 26.5 23.3 24.5 26.5
Non-deductible expenditure and non-taxable income 16.6 2.0 1.9 1.9 1.0 2.7
Non-recoverable withholding taxes 1.2 2.0 4.5 1.2 2.0 5.1
Net effect of different rates of tax in overseas businesses 11.6 7.7 4.5 11.9 7.8 4.9
Effect of changes in tax rates (0.1) (0.3) (0.5) (0.1) (0.1) (0.4)
Benefit of tax reliefs on which no deferred tax previously recognised (15.0) (5.6) (2.9) (1.1) (5.6) (3.3)
Effect of adjustments to estimated recoverable deferred tax assets (6.4) (19.4) (2.2) (4.9) (0.2) (0.3)
Adjustment to tax charge in respect of prior periods (2.2) (9.8) (18.4) (2.1) (2.5) (12.4)
Deferred tax provision on unremitted earnings 10.5 – – –– –
Other (1.8) 0.4 0.8 (0.6) 0.5 1.2
37.7 1.5 14.2 29.5 27.4 24.0
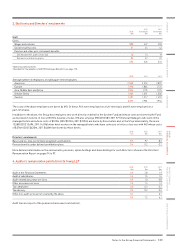
Tax paid
Total net tax paid during the year of $97m (2012 $122m, 2011 $90m) comprises $92m (2012 $119m, 2011 $89m) paid in respect of operating
activities and $5m (2012 $3m, 2011 $1m) paid in respect of investing activities.
Tax paid represents an effective rate of 16% (20121 22%, 20111 16%) on total profits and is lower than the effective income statement tax
rate of 29% (2012 27%, 2011 24%) primarily due to the impact of deferred taxes (including the realisation of assets such as tax losses),
the receipt of refunds in respect of prior years and provisions for tax for which no payment of tax has currently been made.
Corporation tax liabilities did not arise in 2013 in the UK and are not expected to arise for a number of years thereafter due to expenses
and associated tax losses attributable principally to employment matters, inparticular additional shortfall contributions made to the UK
pension plan in the years 2007 to 2013.
Tax risks, policies and governance
Information concerning the Group’s tax governance can be found in the Taxation section of the Strategic Report on page 51.
1 Restated for the adoption of IAS I9R ‘Employee Benefits’ (see page 111).
2 Calculated in relation to total profits including exceptional items.
3 See note on ‘Comparatives for 2011’ on page 111.
4 Calculated in relation to profits excluding exceptional items.
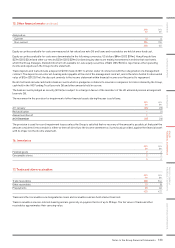
8. Dividends and shareholder returns
2013
cents per
share
2012
cents per
share
2011
cents per
share
2013
$m
2012
$m
2011
$m
Paid during the year:
Final (declared for previous year) 43.0 39.0 35.2 115 113 102
Interim 23.0 21.0 16.0 63 61 46
Special (note 29) 133.0 172.0 –355 505 –
199.0 232.0 51.2 533 679 148
Proposed (not recognised as a liability at 31 December):
Final 47.0 43.0 39.0 121 115 113
The final dividend of 28.1p (47.0¢ converted at the closing exchange rate on 14 February 2014) is proposed for approval at the Annual
General Meeting (AGM) on 2 May 2014 and is payable on the shares in issue at 21 March 2014.
Under the $500m share repurchase programme announced 7 August 2012, 9,773,912 shares were repurchased in the year to 31 December
2013 for a consideration of $283m, increasing the total amount repurchased to $390m. All of the shares repurchased in 2013 were held
as treasury shares at 31 December 2013, the cost of which has been deducted from retained earnings. There were no treasury shares
held at 31December 2012 or earlier.
126 IHG Annual Report and Form 20-F 2013
Notes to the Group Financial Statements continued