Holiday Inn 2013 Annual Report Download - page 49
Download and view the complete annual report
Please find page 49 of the 2013 Holiday Inn annual report below. You can navigate through the pages in the report by either clicking on the pages listed below, or by using the keyword search tool below to find specific information within the annual report.-
 1
1 -
2
-
3
-
4
-
5
-
6
-
7
-
8
-
9
-
10
-
11
-
12
-
13
-
14
-
15
-
16
-
17
-
18
-
19
-
20
-
21
-
22
-
23
-
24
-
25
-
26
-
27
-
28
-
29
-
30
-
31
-
32
-
33
-
34
-
35
-
36
-
37
-
38
-
 39
39 -
 40
40 -
 41
41 -
 42
42 -
 43
43 -
 44
44 -
 45
45 -
 46
46 -
 47
47 -
 48
48 -
 49
49 -
 50
50 -
 51
51 -
 52
52 -
 53
53 -
 54
54 -
 55
55 -
 56
56 -
 57
57 -
 58
58 -
 59
59 -
60
-
61
-
62
-
63
-
64
-
65
-
66
-
67
-
68
-
69
-
70
-
71
-
72
-
73
-
74
-
75
-
76
-
77
-
78
-
79
-
80
-
81
-
82
-
83
-
84
-
85
-
86
-
87
-
88
-
89
-
90
-
91
-
92
-
93
-
94
-
95
-
96
-
97
-
98
-
99
-
100
-
101
-
102
-
103
-
104
-
105
-
106
-
107
-
108
-
109
-
110
-
111
-
112
-
113
-
114
-
115
-
116
-
117
-
118
-
119
-
120
-
121
-
122
-
123
-
124
-
125
-
126
-
127
-
128
-
129
-
130
-
131
-
132
-
133
-
134
-
135
-
136
-
137
-
138
-
139
-
140
-
141
-
142
-
143
-
144
-
145
-
146
-
147
-
148
-
149
-
150
-
151
-
152
-
153
-
154
-
155
-
156
-
157
-
158
-
159
-
160
-
161
-
162
-
163
-
164
-
165
-
166
-
167
-
168
-
169
-
170
-
171
-
172
-
173
-
174
-
175
-
176
-
177
-
178
-
179
-
180
-
181
-
182
-
183
-
184
-
185
-
186
-
187
-
188
-
189
-
190
-
191
-
192
 |
 |

The AMEA hotel and room count in the year increased by 12 hotels
(2,101 rooms) to 244 hotels (64,838 rooms). The level of openings
increased from 16 hotels (4,243 rooms) in 2012 to 20 hotels (4,495
rooms) in 2013. This included two hotel openings (624 rooms) for
the InterContinental brand, including the 272-room InterContinental
Osaka, and five hotels in India (818 rooms) in 2013, including Crowne
Plaza and Holiday Inn conversions in New Delhi’s emerging
business district of Mayur Vihar.
Eight hotels (2,394 rooms) were removed from the AMEA System
in 2013, compared to 12 hotels (2,589 rooms) in 2012.
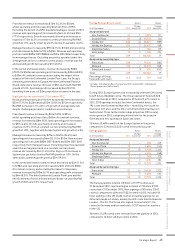
AMEA pipeline Hotels Rooms
At 31 December 2013
Change
over 2012 2013
Change
over 2012
Analysed by brand
InterContinental 21 15,378 12
Crowne Plaza 14 (4) 4,048 (1,297)
Holiday Inn149 212,341 1,446
Holiday Inn Express 39 47,980 889
Staybridge Suites 6–935 207
Hotel Indigo 821,392 460
Total 137 532,074 1,717
Analysed by ownership type
Franchised 31647 222
Managed 134 431,427 1,495
Total 137 532,074 1,717
1
Includes 6 Holiday Inn Resort properties (1,579 rooms) (2012: 4 Holiday Inn
Resort properties (900 rooms)).
The AMEA pipeline totalled 137 hotels (32,074 rooms) as at
31December 2013, compared to 132 hotels (30,357 rooms) as
at 31December 2012. Signings of 36 hotels (8,687 rooms) were
broadly inline with last year and included 26 hotels (6,546 rooms)
in the Holiday Inn brand family, notably the 1,230-room Holiday Inn
Makkah Al Aziziah in Saudi Arabia, which is set to be the largest
Holiday Inn in the world when it opens. Three InterContinental
hotels (671 rooms) were signed during 2013, including the
140-room InterContinental Sydney Double Bay in Australia.
11 hotels (2,475 rooms) were removed from the pipeline in 2013,
compared to 10 hotels (2,850 rooms) in 2012.
$21m and operating profit of $1m. Excluding this property together
with the benefit of the $6m liquidated damages receipt in 2013,
revenue and operating profit decreased by $4m (2.6%) and $4m
(4.4%) respectively at constant currency. RevPAR increased by
5.6%, with AMEA System size up 2.6%.
In the owned and leased estate, revenue and operating profit
decreased by $4m (8.3%) to $44m and by $2m (33.3%) to $4m
respectively, driven by a 7.3% RevPAR decline.
Highlights for the year ended 31 December 2012
Revenue and operating profit before exceptional items increased
by$2m (0.9%) to $218m and by $4m (4.8%) to $88m respectively.
RevPAR increased 4.9%, with 1.2% growth in average daily rate,
withrobust trading in Southeast Asia and Japan, partly offset by
continuing uncertainty impacting some markets in the Middle East.
On both a constant and actual currency basis, franchised revenue
decreased by $1m (5.3%) to $18m and operating profit was flat
at$12m.
Managed revenue and operating profit increased by $1m (0.7%)
to $152m and by $3m (3.4%) to $90m respectively. At constant
currency, excluding the benefit of a $6m liquidated damages
receipt in 2011 and after adjusting for the disposal of a hotel asset
and partnership interest in Australia, which contributed $3m to
operating profit in 2011, revenue and operating profit increased
by $7m (4.8%) and $11m (14.1%) respectively. RevPAR growth was
4.6% and although year-end AMEA System size was 7.1% higher
than at the end of 2011, due to the phasing of openings towards the
end of the year, rooms available during the year grew by only 2.2%.
Operating profit in 2012 benefited from a $1m increase in profit
from an associate and $2m lower year-on-year bad debt expense.
In the owned and leased estate, revenue and operating profit
increased by $2m (4.3%) to $48m and by $1m (20.0%) to
$6mrespectively.
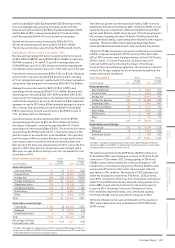
AMEA hotel and room count Hotels Rooms
At 31 December 2013
Change
over 2012 2013
Change
over 2012
Analysed by brand
InterContinental 67 221,383 592
Crowne Plaza 67 219,078 519
Holiday Inn181 618,464 1,024
Holiday Inn Express 16 43,500 623
Staybridge Suites 31425 121
Other 10 (3) 1,988 (778)
Total 244 12 64,838 2,101
Analysed by ownership type
Franchised 51 311,611 751
Managed 191 952,640 1,350
Owned and leased 2–587 –
Total 244 12 64,838 2,101
Percentage of Group
hotel and room count 5.2 0.2 9.4 0.1
1
Includes 14 Holiday Inn Resort properties (2,965 rooms) (2012: 14 Holiday Inn
Resort properties (3,311 rooms)).
Strategic Report 47
OVERVIEW STRATEGIC REPORT GOVERNANCE
GROUP
FINANCIAL STATEMENTS
PARENT COMPANY
FINANCIAL STATEMENTS ADDITIONAL INFORMATION