Holiday Inn 2013 Annual Report Download - page 96
Download and view the complete annual report
Please find page 96 of the 2013 Holiday Inn annual report below. You can navigate through the pages in the report by either clicking on the pages listed below, or by using the keyword search tool below to find specific information within the annual report.-
 1
1 -
2
-
3
-
4
-
5
-
6
-
7
-
8
-
9
-
10
-
11
-
12
-
13
-
14
-
15
-
16
-
17
-
18
-
19
-
20
-
21
-
22
-
23
-
24
-
25
-
26
-
27
-
28
-
29
-
30
-
31
-
32
-
33
-
34
-
35
-
36
-
37
-
38
-
39
-
40
-
41
-
42
-
43
-
44
-
45
-
46
-
47
-
48
-
49
-
50
-
51
-
52
-
53
-
54
-
55
-
56
-
57
-
58
-
59
-
60
-
61
-
62
-
63
-
64
-
65
-
66
-
67
-
68
-
69
-
70
-
71
-
72
-
73
-
74
-
75
-
76
-
77
-
78
-
79
-
80
-
81
-
82
-
83
-
84
-
85
-
 86
86 -
 87
87 -
 88
88 -
 89
89 -
 90
90 -
 91
91 -
 92
92 -
 93
93 -
 94
94 -
 95
95 -
 96
96 -
 97
97 -
 98
98 -
 99
99 -
 100
100 -
 101
101 -
 102
102 -
 103
103 -
 104
104 -
 105
105 -
 106
106 -
107
-
108
-
109
-
110
-
111
-
112
-
113
-
114
-
115
-
116
-
117
-
118
-
119
-
120
-
121
-
122
-
123
-
124
-
125
-
126
-
127
-
128
-
129
-
130
-
131
-
132
-
133
-
134
-
135
-
136
-
137
-
138
-
139
-
140
-
141
-
142
-
143
-
144
-
145
-
146
-
147
-
148
-
149
-
150
-
151
-
152
-
153
-
154
-
155
-
156
-
157
-
158
-
159
-
160
-
161
-
162
-
163
-
164
-
165
-
166
-
167
-
168
-
169
-
170
-
171
-
172
-
173
-
174
-
175
-
176
-
177
-
178
-
179
-
180
-
181
-
182
-
183
-
184
-
185
-
186
-
187
-
188
-
189
-
190
-
191
-
192
 |
 |
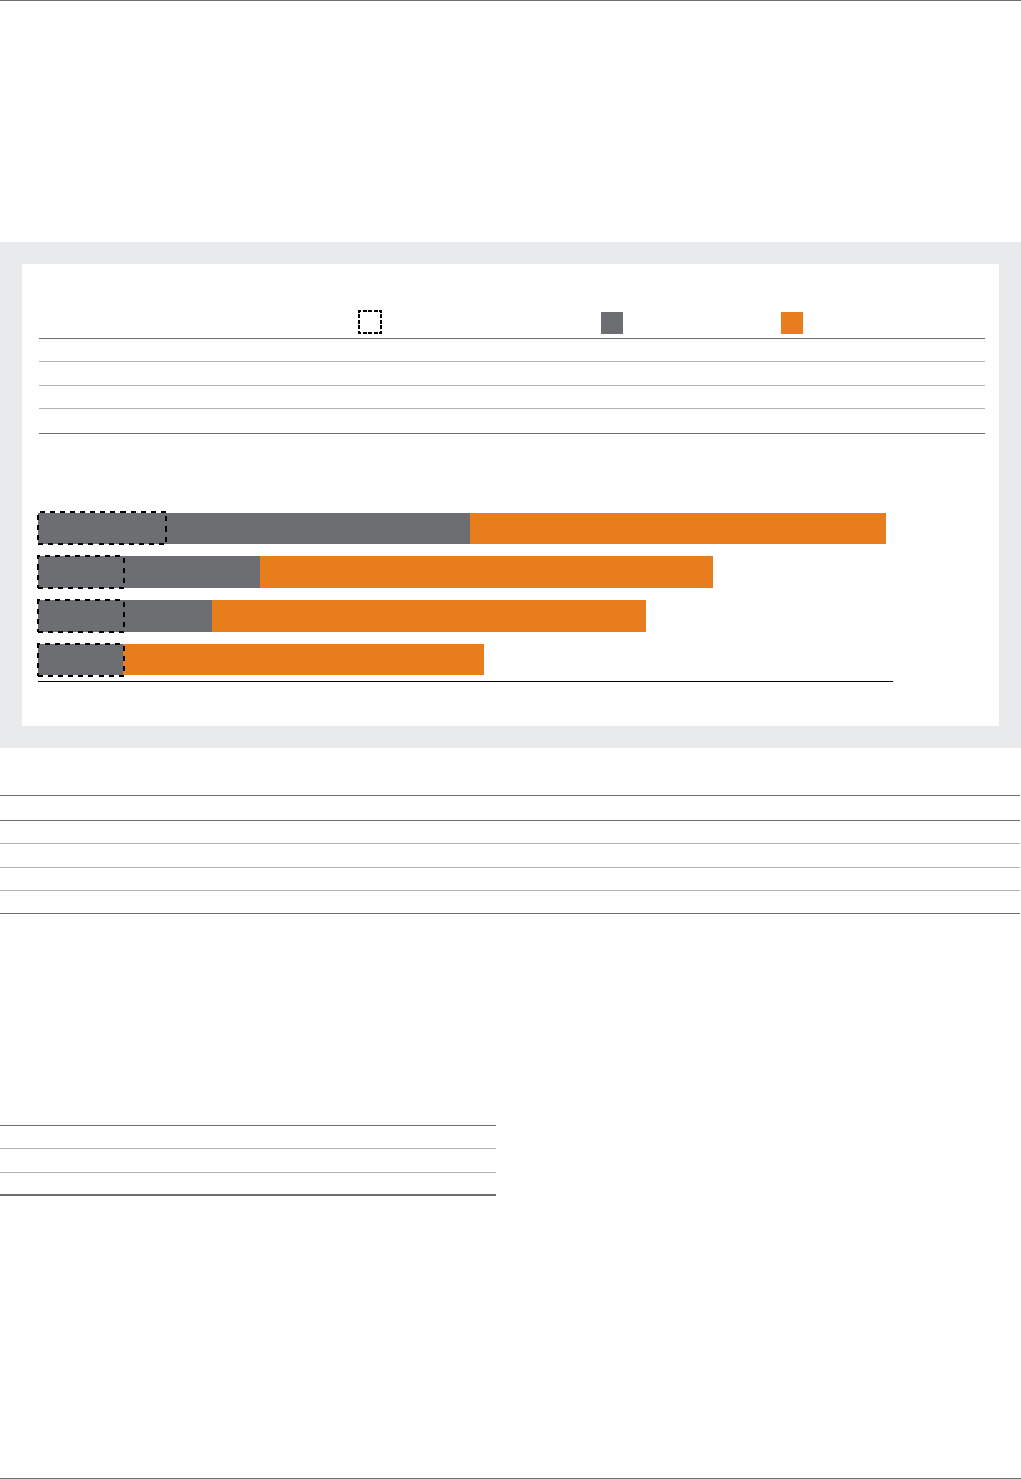
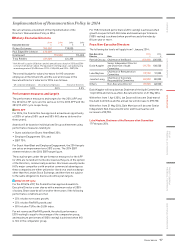
% of salary
0 200 400 600 800 1000 1200 1400 1600 1800 2000
Richard Solomons
Kirk Kinsell
Tracy Robbins
Tom Singer
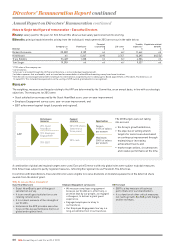
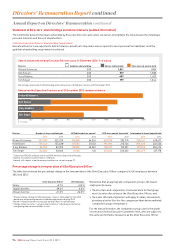
Statement of Directors’ shareholdings and share interests (audited information)
The Committee believes that share ownership by Executive Directors and senior executives strengthens the link between the individuals’
personal interests and those of shareholders.
Guideline Executive Director shareholding requirement
Executive Directors are expected to hold all shares earned (net of any share sales required to meet personal tax liabilities), until the
guideline shareholding requirement is achieved.
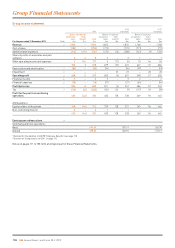
Shares and awards held by Executive Directors as at 31 December 2013: % of salary
Director Guideline shareholding Shares held outright Total shares & awards held
Richard Solomons 300 1,011 1,985
Kirk Kinsell 200 519 1,580
Tracy Robbins 200 407 1,423
Tom Singer 200 199 1,044
Percentages are based on shareholding and a share price of 2,013p per share as at 31 December 2013.
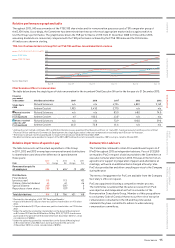
Shares held by Executive Directors as at 31 December 2013: number of shares
Director Number of shares held outright APP deferred share awards2LTIP share awards (unvested)3Total number of shares & awards held
2013 2012 2013 2012 2013 2012 2013 2012
Richard Solomons 371,198 322,379 90,068 64,524 267,275 292,774 728,541 679,677
Kirk Kinsell 127,4441155,628166,502 50,152 194,384 216,746 388,330 422,526
Tracy Robbins 85,703 85,703 55,905 40,381 158,337 170,391 299,945 296,475
Tom Singer 54,386 20,846 17,930 n/a 213,263 226,332 285,579 247,178
1 Comprised 155,034 ordinary shares and 594 American Depositary Receipts.
2 Awards not subject to performance conditions.
3 Awards still subject to performance conditions as set out on page 97.
Percentage change in remuneration of Chief Executive Officer
The table below shows the percentage change in the remuneration of the Chief Executive Officer compared to UK employees between
2012 and 2013:
Chief Executive Officer UK employees
Salary +2.7% +3.5%1
Taxable benefits -29.0% 0.0%2
Annual incentive +11.0% +16.0%3
1
The percentage change for UK employees shown is the budget for the 2013
annual pay review and promotions/market adjustments during 2013.
2 Based on taxable benefits for tax year ending 5 April in relevant year.
3
Change shown assumes “very good performance” individual performance
rating and global responsibilities in role.
We believe that an appropriate comparator group is UK-based
employees because:
• the structure and composition of remuneration for that group
most closely reflects that of the Chief Executive Officer; and
• the same UK market dynamics will apply to salary movements,
providing a better like-for-like comparison than an international
comparator group of employees.
For the annual incentive, the comparator group used is the grade
of executives below Executive Committee level, who are subject to
the same performance measures as the Chief Executive Officer.
94 IHG Annual Report and Form 20-F 2013
Directors’ Remuneration Report continued
Annual Report on Directors’ Remuneration continued