Holiday Inn 2013 Annual Report Download - page 81
Download and view the complete annual report
Please find page 81 of the 2013 Holiday Inn annual report below. You can navigate through the pages in the report by either clicking on the pages listed below, or by using the keyword search tool below to find specific information within the annual report.-
 1
1 -
2
-
3
-
4
-
5
-
6
-
7
-
8
-
9
-
10
-
11
-
12
-
13
-
14
-
15
-
16
-
17
-
18
-
19
-
20
-
21
-
22
-
23
-
24
-
25
-
26
-
27
-
28
-
29
-
30
-
31
-
32
-
33
-
34
-
35
-
36
-
37
-
38
-
39
-
40
-
41
-
42
-
43
-
44
-
45
-
46
-
47
-
48
-
49
-
50
-
51
-
52
-
53
-
54
-
55
-
56
-
57
-
58
-
59
-
60
-
61
-
62
-
63
-
64
-
65
-
66
-
67
-
68
-
69
-
70
-
 71
71 -
 72
72 -
 73
73 -
 74
74 -
 75
75 -
 76
76 -
 77
77 -
 78
78 -
 79
79 -
 80
80 -
 81
81 -
 82
82 -
 83
83 -
 84
84 -
 85
85 -
 86
86 -
 87
87 -
 88
88 -
 89
89 -
 90
90 -
 91
91 -
92
-
93
-
94
-
95
-
96
-
97
-
98
-
99
-
100
-
101
-
102
-
103
-
104
-
105
-
106
-
107
-
108
-
109
-
110
-
111
-
112
-
113
-
114
-
115
-
116
-
117
-
118
-
119
-
120
-
121
-
122
-
123
-
124
-
125
-
126
-
127
-
128
-
129
-
130
-
131
-
132
-
133
-
134
-
135
-
136
-
137
-
138
-
139
-
140
-
141
-
142
-
143
-
144
-
145
-
146
-
147
-
148
-
149
-
150
-
151
-
152
-
153
-
154
-
155
-
156
-
157
-
158
-
159
-
160
-
161
-
162
-
163
-
164
-
165
-
166
-
167
-
168
-
169
-
170
-
171
-
172
-
173
-
174
-
175
-
176
-
177
-
178
-
179
-
180
-
181
-
182
-
183
-
184
-
185
-
186
-
187
-
188
-
189
-
190
-
191
-
192
 |
 |

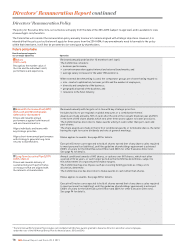
Maximum opportunity Performance framework
•
•
•
•
•
•
•
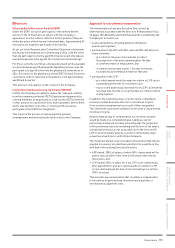
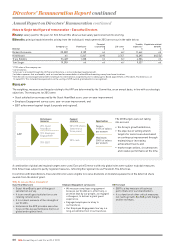
Over the policy period, salaries for current
Executive Directors will increase in line
with the range of increases applying to the
corporate UK and US employee population,
other than where there is a change in role
or responsibility, or a significant variance
to the market arises, that warrants a more
significant increase. Any such changes will
be fully explained.
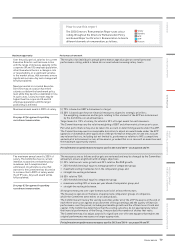
Newly promoted or recruited Executive
Directors may on occasion have their
salaries set below the benchmark policy
level while they become established in role.
In such cases, salary increases may be
higher than the corporate UK and US
employee population until the target
positioning is achieved.
The results of an individual’s annual performance appraisal give an overall personal
performance rating, which is taken into account when reviewing salary levels.
Maximum annual award is 200% of salary.
See page 83 for approach regarding
recruitment remuneration.
(i) 70% is based on EBIT achievement vs target.
(ii) 30% is based upon key non-financial measures aligned to strategicpriorities;
the weighting, measures and targets relating to this element of the APP are determined
by the Committee on an annual basis.
Target award is 115% of salary; threshold is 50% of target award for each measure.
The Committee may vary the relative weighting of EBIT and other metrics from year to year.
Personal performance may also be taken into account in determining awards under the APP.
The Committee may exercise reasonable discretion to adjust an award made under the APP
upwards or downwards after application of the performance measures to take into account
any relevant factors, including but not limited to, performance relative to IHG’s competitors
and extent of achievement across all measures, provided that in no case will an award exceed
the maximum opportunity stated.
For information on performance measures used in 2013 and 2014 – see pages 88 and 97.
The maximum annual award is 205% of
salary. The Committee has no current
intention to award more than the policy
maximum, but if exceptional and
unforeseen circumstances arise that
warrant it, the Committee has discretion
to increase this to 300% of salary under
the LTIP rules. Any such award will be
fully explained.
See page 83 for approach regarding
recruitment remuneration.
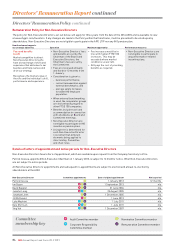
The measures are as follows and targets are reviewed and may be changed by the Committee
annually to ensure alignment with strategic objectives:
(i) 25% relative net rooms growth and 25% relative RevPAR growth:
• 20% threshold vesting if equal to average growth of comparator group;
• maximum vesting if ranked as 1st in the comparator group; and
• straight-line vesting in between.
(ii) 50% relative TSR:
• 20% threshold vesting if equal to comparator group;
• maximum vesting if 8% or more per year ahead of comparator group;and
• straight-line vesting in between.
All targets measured over a performance period of at least threeyears.
The measures operate on the basis of appropriate comparator groups of companies,
which the Committee determines on an annualbasis.
The Committee will review the vesting outcomes under all of the LTIP measures at the end of
each three-year cycle against an assessment of Group earnings and the quality of financial
performance over the period, including sustainable growth and the efficient use of cash and
capital. If the Committee determines that the vesting outcomes do not appropriately reflect
the financial performance of the Group, itmay reduce the number of shares that vests.
The Committee may also adjust awards if a significant one-off event happens that makes the
original performance measures no longer appropriate.
For information on performance measures used in 2013 and 2014 – see pages 90 and 97.
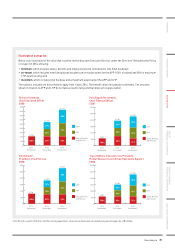
How to use this report
The 2013 Directors’ Remuneration Report uses colour
coding throughout the Directors’ Remuneration Policy
and Annual Report on Directors’ Remuneration to denote
different elements of remuneration, as follows:
Salary
Benefits
APP
LTIP
Pension
Governance 79
OVERVIEW STRATEGIC REPORT GOVERNANCE
GROUP
FINANCIAL STATEMENTS
PARENT COMPANY
FINANCIAL STATEMENTS ADDITIONAL INFORMATION