Holiday Inn 2013 Annual Report Download - page 181
Download and view the complete annual report
Please find page 181 of the 2013 Holiday Inn annual report below. You can navigate through the pages in the report by either clicking on the pages listed below, or by using the keyword search tool below to find specific information within the annual report.-
 1
1 -
2
-
3
-
4
-
5
-
6
-
7
-
8
-
9
-
10
-
11
-
12
-
13
-
14
-
15
-
16
-
17
-
18
-
19
-
20
-
21
-
22
-
23
-
24
-
25
-
26
-
27
-
28
-
29
-
30
-
31
-
32
-
33
-
34
-
35
-
36
-
37
-
38
-
39
-
40
-
41
-
42
-
43
-
44
-
45
-
46
-
47
-
48
-
49
-
50
-
51
-
52
-
53
-
54
-
55
-
56
-
57
-
58
-
59
-
60
-
61
-
62
-
63
-
64
-
65
-
66
-
67
-
68
-
69
-
70
-
71
-
72
-
73
-
74
-
75
-
76
-
77
-
78
-
79
-
80
-
81
-
82
-
83
-
84
-
85
-
86
-
87
-
88
-
89
-
90
-
91
-
92
-
93
-
94
-
95
-
96
-
97
-
98
-
99
-
100
-
101
-
102
-
103
-
104
-
105
-
106
-
107
-
108
-
109
-
110
-
111
-
112
-
113
-
114
-
115
-
116
-
117
-
118
-
119
-
120
-
121
-
122
-
123
-
124
-
125
-
126
-
127
-
128
-
129
-
130
-
131
-
132
-
133
-
134
-
135
-
136
-
137
-
138
-
139
-
140
-
141
-
142
-
143
-
144
-
145
-
146
-
147
-
148
-
149
-
150
-
151
-
152
-
153
-
154
-
155
-
156
-
157
-
158
-
159
-
160
-
161
-
162
-
163
-
164
-
165
-
166
-
167
-
168
-
169
-
170
-
 171
171 -
 172
172 -
 173
173 -
 174
174 -
 175
175 -
 176
176 -
 177
177 -
 178
178 -
 179
179 -
 180
180 -
 181
181 -
 182
182 -
 183
183 -
 184
184 -
 185
185 -
 186
186 -
 187
187 -
 188
188 -
 189
189 -
 190
190 -
 191
191 -
192
 |
 |
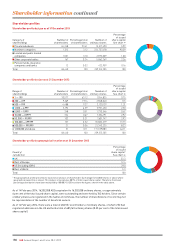
Purchases of equity securities by the Company and affiliated purchasers
The Group’s current $500 million share repurchase programme was announced on 7 August 2012. By 31 December 2013, 11,484,351
shares had been repurchased at an average price of 1,865.5301 pence per share (approximately £214 million).
Period of financial year
(a) Total number of shares
(or units) purchased
(b) Average price paid per
share(or unit)
(c) Total number of shares
(orunits) purchased as
partofpublicly announced
plans or programmes
(d) Maximum number (or
approximate dollar value) of
shares (or units) that may yet
bepurchased under the plans
orprogrammes
Month 1 (no purchases this month) nil nil nil 23,073,3411
Month 2 1,160,68 8 1,948.9099 100,000 21,912,6531
Month 3 (no purchases this month) nil nil nil 21,912,6531
Month 4 1,369,415 1,895.7360 1,369,415 20,543,2381
Month 5 (pre-AGM) 323,758 1,924.0195 323,758 20,219,4801
Month 5 (post-AGM) 370,872 1,918.4721 370,872 26,464,8752
Month 6 2,613,459 1,811.3233 2,613,459 23,851,4162
Month 7 (no purchases this month) nil nil nil 23,851,4162
Month 8 1,263,366 1,876.4824 1,263,366 22,588,0502
Month 9 1,732,537 1,849.5455 1,732,537 20,855,5132
Month 10 1,308,941 1,808.6041 1,308,941 19,546,5722
Month 11 691,564 1,810.6577 691,564 18,855,0082
Month 12 649,751 2,006.0014 nil 18,855,0082
1 Reflects the resolution passed at the Company’s General Meeting held on 8 October 2012.
2 Reflects the resolution passed at the Company’s AGM held on 24 May 2013.
During the financial year ended 31 December 2013, 1,196,061 ordinary shares were purchased by the Company’s Employee Share Ownership
Trust at prices ranging from 1,939 pence to 2,028 pence per share, for the purpose of satisfying future share awards to employees.
Share price information
The principal trading market for the Company’s ordinary shares is the London Stock Exchange (LSE). The ordinary shares are also listed
on the NYSE trading in the form of ADSs evidenced by ADRs. Each ADS represents one ordinary share. The Company has a sponsored ADR
facility with JPMorgan as ADR Depositary. The following table shows, for the financial periods indicated, the reported high and low middle
market quotations (which represent an average of closing bid and ask prices) for the ordinary shares on the LSE, as derived from the
Official List of the UK Listing Authority, and the highest and lowest sales prices of the ADSs as reported on the NYSE composite tape.
£ per ordinary share $ per ADS1
Year ended 31 December high low high low
2009 9.04 4.46 14.67 6.04
2010 12.66 8.87 20.04 13.84
2011 14.35 9.55 23.28 15.27
2012 17.25 11.57 27.82 17.99
2013 20.39 17.07 33.54 26.90
Quarters in the year ended 31 December
2012
First quarter 14.97 11.57 23.67 17.99
Second quarter 15.73 13.95 24.70 21.84
Third quarter 17.25 15.02 27.02 23.16
Fourth quarter 17.10 15.24 27.82 24.50
2013
First quarter 20.22 17.07 30.64 27.82
Second quarter 20.39 17.37 30.61 26.90
Third quarter 20.30 17.88 31.08 27.77
Fourth quarter 20.25 17.6 3 33.54 28.27
2014
First quarter (through to 14 February 2014) 2,038 1,942 34.08 31.69
Month ended
August 2013 20.30 17.88 31.08 27.77
September 2013 19.16 18.02 30.26 28.09
October 2013 18.65 17.6 3 30.39 28.27
November 2013 19.08 17.94 31.22 28.74
December 2013 20.25 18.82 33.54 30.90
January 2014 20.38 19.66 34.08 32.44
February 2014 (through to 14 February 2014) 2,003 1,942 33.78 31.69
1
Fluctuations in the exchange rates between sterling and the US dollar will affect the dollar equivalent of the sterling price of the ordinary shares on the LSE and, as a
result, are likely to affect the market price of ADSs.
Additional Information 179
OVERVIEW STRATEGIC REPORT GOVERNANCE
GROUP
FINANCIAL STATEMENTS
PARENT COMPANY
FINANCIAL STATEMENTS ADDITIONAL INFORMATION