Holiday Inn 2013 Annual Report Download - page 16
Download and view the complete annual report
Please find page 16 of the 2013 Holiday Inn annual report below. You can navigate through the pages in the report by either clicking on the pages listed below, or by using the keyword search tool below to find specific information within the annual report.-
 1
1 -
2
-
3
-
4
-
5
-
 6
6 -
 7
7 -
 8
8 -
 9
9 -
 10
10 -
 11
11 -
 12
12 -
 13
13 -
 14
14 -
 15
15 -
 16
16 -
 17
17 -
 18
18 -
 19
19 -
 20
20 -
 21
21 -
 22
22 -
 23
23 -
 24
24 -
 25
25 -
 26
26 -
27
-
28
-
29
-
30
-
31
-
32
-
33
-
34
-
35
-
36
-
37
-
38
-
39
-
40
-
41
-
42
-
43
-
44
-
45
-
46
-
47
-
48
-
49
-
50
-
51
-
52
-
53
-
54
-
55
-
56
-
57
-
58
-
59
-
60
-
61
-
62
-
63
-
64
-
65
-
66
-
67
-
68
-
69
-
70
-
71
-
72
-
73
-
74
-
75
-
76
-
77
-
78
-
79
-
80
-
81
-
82
-
83
-
84
-
85
-
86
-
87
-
88
-
89
-
90
-
91
-
92
-
93
-
94
-
95
-
96
-
97
-
98
-
99
-
100
-
101
-
102
-
103
-
104
-
105
-
106
-
107
-
108
-
109
-
110
-
111
-
112
-
113
-
114
-
115
-
116
-
117
-
118
-
119
-
120
-
121
-
122
-
123
-
124
-
125
-
126
-
127
-
128
-
129
-
130
-
131
-
132
-
133
-
134
-
135
-
136
-
137
-
138
-
139
-
140
-
141
-
142
-
143
-
144
-
145
-
146
-
147
-
148
-
149
-
150
-
151
-
152
-
153
-
154
-
155
-
156
-
157
-
158
-
159
-
160
-
161
-
162
-
163
-
164
-
165
-
166
-
167
-
168
-
169
-
170
-
171
-
172
-
173
-
174
-
175
-
176
-
177
-
178
-
179
-
180
-
181
-
182
-
183
-
184
-
185
-
186
-
187
-
188
-
189
-
190
-
191
-
192
 |
 |
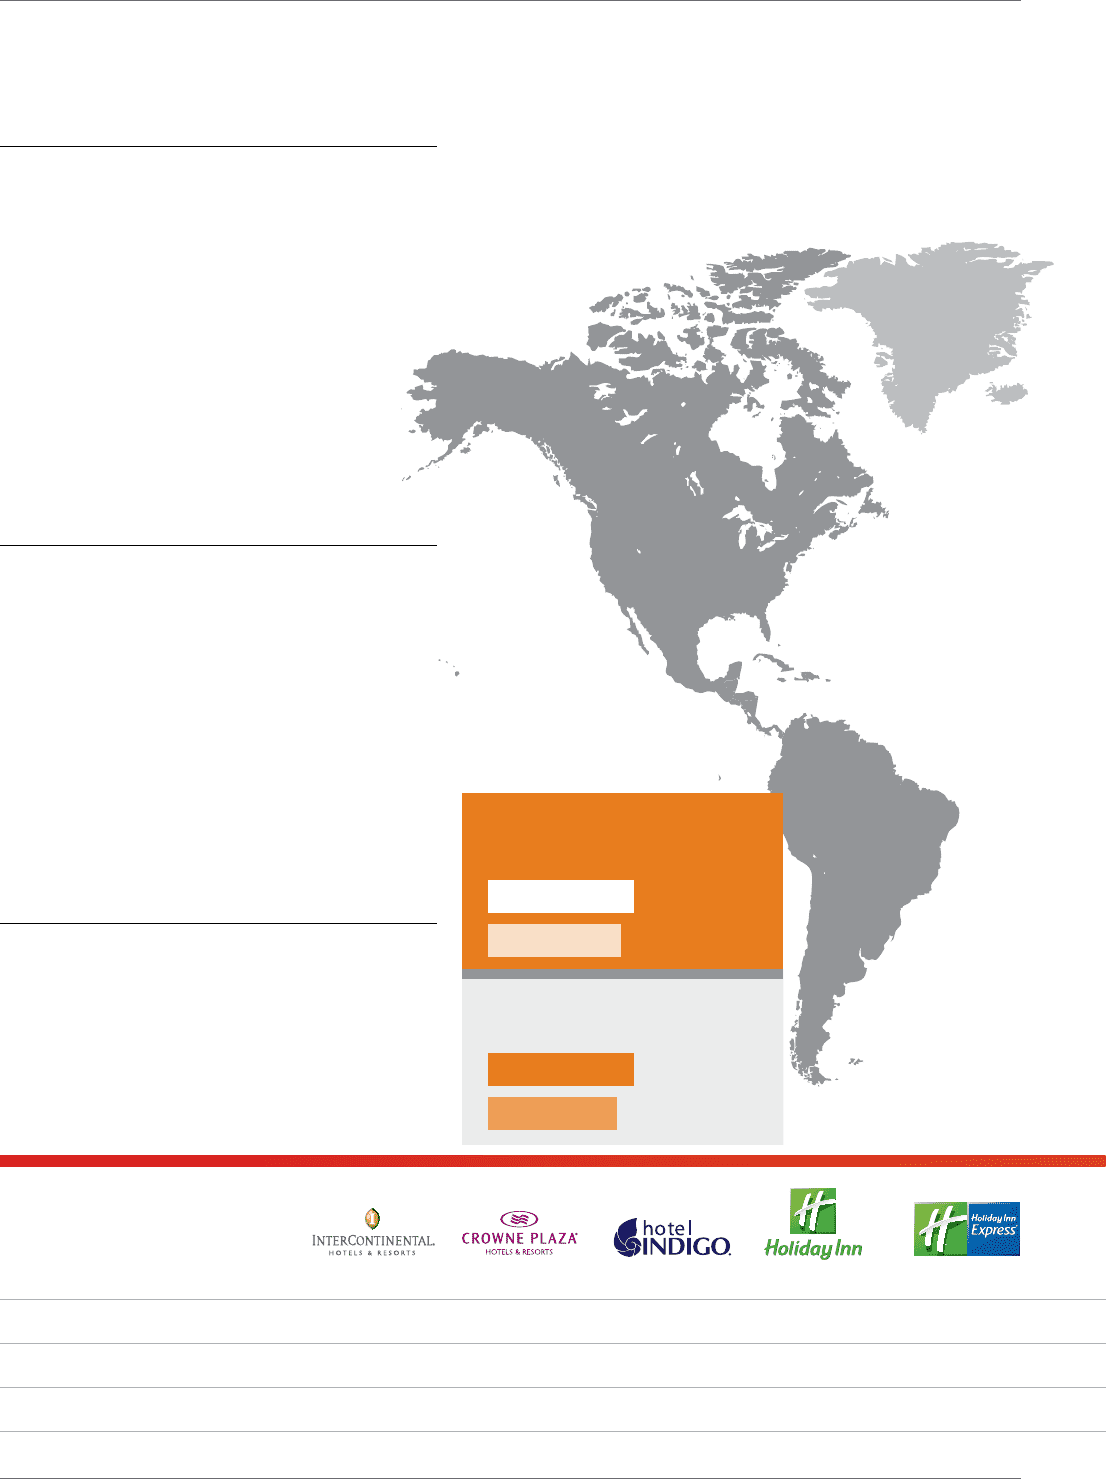
2012
2013 $916m†
$837m◊
2012
2013 $550m†
$486m◊
*All facts and figures as at 31 December 2013.
† Includes three liquidated damages receipts in 2013;
$31m in The Americas, $9m in Europe and $6m in AMEA.
◊ Includes one significant liquidated damages receipt in 2012;
$3m in The Americas.
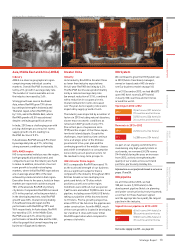
Where we operate
We operate in nearly 100countries
andterritories globally.
Details of our Targeted Portfolio are set out on pages 28 and 29.
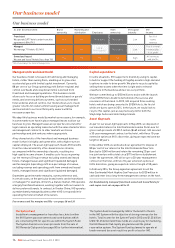
Our business model
711
9
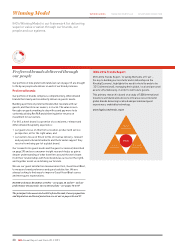
Our strategy for
high-quality growth
We focus on delivering high-quality growth, which for
us means delivering consistent, sustained growth in
cash flows and profits over the longer term. We do this
by staying focused on our Targeted Portfolio and building
preferred brands, driven by a deep understanding of
guests’ needs. IHG’s Winning Model, combined with a
Targeted Portfolio underpinned by Disciplined Execution,
will drive superior returns for IHG’s shareholders.
Details on our performance globally and in each of our regions
is set out on pages 40 to 50.
Franchised hotels
Managed hotels
Owned and leased hotels
Our business model is detailed on page 16.
Operating profit before
exceptional items
Revenue
The Americas
3,977
Our brand
portfolio
Hotels 178 391 55 1,168 2,258
Rooms 60,103 108,891 6,199 212,058 214,597
Rooms (hotels) in the pipeline 16,860 (51) 28,369 (94) 6,807 (51) 46,958 (249) 54,744 (473)
14 IHG Annual Report and Form 20-F 2013
IHG at a glance*