Holiday Inn 2013 Annual Report Download - page 129
Download and view the complete annual report
Please find page 129 of the 2013 Holiday Inn annual report below. You can navigate through the pages in the report by either clicking on the pages listed below, or by using the keyword search tool below to find specific information within the annual report.-
 1
1 -
2
-
3
-
4
-
5
-
6
-
7
-
8
-
9
-
10
-
11
-
12
-
13
-
14
-
15
-
16
-
17
-
18
-
19
-
20
-
21
-
22
-
23
-
24
-
25
-
26
-
27
-
28
-
29
-
30
-
31
-
32
-
33
-
34
-
35
-
36
-
37
-
38
-
39
-
40
-
41
-
42
-
43
-
44
-
45
-
46
-
47
-
48
-
49
-
50
-
51
-
52
-
53
-
54
-
55
-
56
-
57
-
58
-
59
-
60
-
61
-
62
-
63
-
64
-
65
-
66
-
67
-
68
-
69
-
70
-
71
-
72
-
73
-
74
-
75
-
76
-
77
-
78
-
79
-
80
-
81
-
82
-
83
-
84
-
85
-
86
-
87
-
88
-
89
-
90
-
91
-
92
-
93
-
94
-
95
-
96
-
97
-
98
-
99
-
100
-
101
-
102
-
103
-
104
-
105
-
106
-
107
-
108
-
109
-
110
-
111
-
112
-
113
-
114
-
115
-
116
-
117
-
118
-
 119
119 -
 120
120 -
 121
121 -
 122
122 -
 123
123 -
 124
124 -
 125
125 -
 126
126 -
 127
127 -
 128
128 -
 129
129 -
 130
130 -
 131
131 -
 132
132 -
 133
133 -
 134
134 -
 135
135 -
 136
136 -
 137
137 -
 138
138 -
 139
139 -
140
-
141
-
142
-
143
-
144
-
145
-
146
-
147
-
148
-
149
-
150
-
151
-
152
-
153
-
154
-
155
-
156
-
157
-
158
-
159
-
160
-
161
-
162
-
163
-
164
-
165
-
166
-
167
-
168
-
169
-
170
-
171
-
172
-
173
-
174
-
175
-
176
-
177
-
178
-
179
-
180
-
181
-
182
-
183
-
184
-
185
-
186
-
187
-
188
-
189
-
190
-
191
-
192
 |
 |
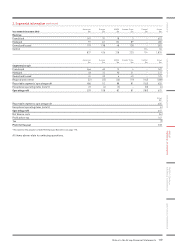
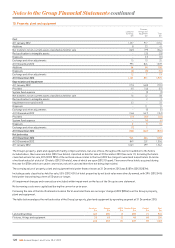
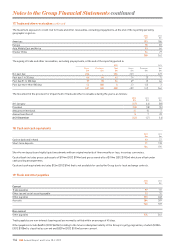
9. Earnings per ordinary share
Basic earnings per ordinary share is calculated by dividing the profit for the year available for IHG equity holders by the weighted average
number of ordinary shares, excluding investment in own shares, in issue during the year.
Diluted earnings per ordinary share is calculated by adjusting basic earnings per ordinary share to reflect the notional exercise of the
weighted average number of dilutive ordinary share options outstanding during the year.
Adjusted earnings per ordinary share is disclosed in order to show performance undistorted by exceptional items, to give a more
meaningful comparison of the Group’s performance.
Continuing and total operations 2013
2012
(restated1)
20112
(restated1)
Basic earnings per ordinary share
Profit available for equity holders ($m) 372 537 465
Basic weighted average number of ordinary shares (millions) 264 287 289
Basic earnings per ordinary share (cents) 140.9 187.1 160.9
Diluted earnings per ordinary share
Profit available for equity holders ($m) 372 537 465
Diluted weighted average number of ordinary shares (millions) 267 292 296
Diluted earnings per ordinary share (cents) 139.3 183.9 157.1
Adjusted earnings per ordinary share
Profit available for equity holders ($m) 372 537 465
Adjusting items (note 5):
Exceptional operating items ($m) (5) 4(57)
Tax on exceptional operating items ($m) 6(1) 4
Exceptional tax ($m) 45 (141) (43)
Adjusted earnings ($m) 418 399 369
Basic weighted average number of ordinary shares (millions) 264 287 289
Adjusted earnings per ordinary share (cents) 158.3 139.0 127.7
Adjusted diluted earnings per ordinary share
Adjusted earnings ($m) 418 399 369
Diluted weighted average number of ordinary shares (millions) 267 292 296
Adjusted diluted earnings per ordinary share (cents) 156.6 136.6 124.7
1 Restated for the adoption of IAS I9R ‘Employee Benefits’ (see page 111).
2 See note on ‘Comparatives for 2011’ on page 111.
2013
millions
2012
millions
2011
millions
Diluted weighted average number of ordinary shares is calculated as:
Basic weighted average number of ordinary shares 264 287 289
Dilutive potential ordinary shares – employee share options 35 7
267 292 296
Notes to the Group Financial Statements 127
OVERVIEW STRATEGIC REPORT GOVERNANCE
GROUP
FINANCIAL STATEMENTS
PARENT COMPANY
FINANCIAL STATEMENTS ADDITIONAL INFORMATION