Holiday Inn 2013 Annual Report Download - page 130
Download and view the complete annual report
Please find page 130 of the 2013 Holiday Inn annual report below. You can navigate through the pages in the report by either clicking on the pages listed below, or by using the keyword search tool below to find specific information within the annual report.-
 1
1 -
2
-
3
-
4
-
5
-
6
-
7
-
8
-
9
-
10
-
11
-
12
-
13
-
14
-
15
-
16
-
17
-
18
-
19
-
20
-
21
-
22
-
23
-
24
-
25
-
26
-
27
-
28
-
29
-
30
-
31
-
32
-
33
-
34
-
35
-
36
-
37
-
38
-
39
-
40
-
41
-
42
-
43
-
44
-
45
-
46
-
47
-
48
-
49
-
50
-
51
-
52
-
53
-
54
-
55
-
56
-
57
-
58
-
59
-
60
-
61
-
62
-
63
-
64
-
65
-
66
-
67
-
68
-
69
-
70
-
71
-
72
-
73
-
74
-
75
-
76
-
77
-
78
-
79
-
80
-
81
-
82
-
83
-
84
-
85
-
86
-
87
-
88
-
89
-
90
-
91
-
92
-
93
-
94
-
95
-
96
-
97
-
98
-
99
-
100
-
101
-
102
-
103
-
104
-
105
-
106
-
107
-
108
-
109
-
110
-
111
-
112
-
113
-
114
-
115
-
116
-
117
-
118
-
119
-
 120
120 -
 121
121 -
 122
122 -
 123
123 -
 124
124 -
 125
125 -
 126
126 -
 127
127 -
 128
128 -
 129
129 -
 130
130 -
 131
131 -
 132
132 -
 133
133 -
 134
134 -
 135
135 -
 136
136 -
 137
137 -
 138
138 -
 139
139 -
 140
140 -
141
-
142
-
143
-
144
-
145
-
146
-
147
-
148
-
149
-
150
-
151
-
152
-
153
-
154
-
155
-
156
-
157
-
158
-
159
-
160
-
161
-
162
-
163
-
164
-
165
-
166
-
167
-
168
-
169
-
170
-
171
-
172
-
173
-
174
-
175
-
176
-
177
-
178
-
179
-
180
-
181
-
182
-
183
-
184
-
185
-
186
-
187
-
188
-
189
-
190
-
191
-
192
 |
 |

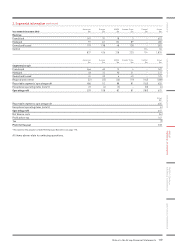
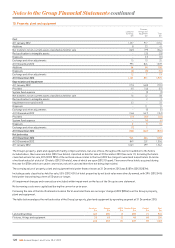
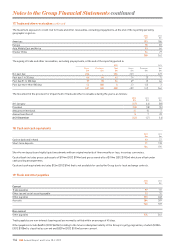
10. Property, plant and equipment
Land and
buildings
$m
Fixtures,
fittings and
equipment
$m
Total
$m
Cost
At 1 January 2012 1,237 917 2,154
Additions 833 41
Net transfers to non-current assets classified as held for sale (265) (99) (364)
Reclassification to intangible assets –(25) (25)
Disposals –(12) (12)
Exchange and other adjustments 15 10 25
At 31 December 2012 995 824 1,819
Additions 96 54 150
Disposals (2) (8) (10)
Exchange and other adjustments 12 113
At 31 December 2013 1,101 871 1,972
Depreciation and impairment
At 1 January 2012 (174) (618) (792)
Provided (11) (46) (57)
System Fund expense –(3) (3)
Net transfers to non-current assets classified as held for sale 16 42 58
Reclassification to intangible assets – 2 2
Impairment reversals (note 5) 23 –23
Disposals –11 11
Exchange and other adjustments –(5) (5)
At 31 December 2012 (146) (617) (763)
Provided (11) (35) (46)
System Fund expense –(4) (4)
Disposals 2 8 10
Exchange and other adjustments (1) 1 –
At 31 December 2013 (156) (647) (803)
Net book value
At 31 December 2013 945 224 1,169
At 31 December 2012 849 207 1,056
At 1 January 2012 1,063 299 1,362
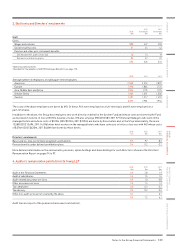
The Group’s property, plant and equipment mainly comprises hotels, but also offices, throughout the world. In addition to the hotels
included above, there was one hotel (2012 two hotels) classified as held for sale at 31 December 2013 (see note 11). Including the hotels
classified as held for sale, 81% (2012 90%) of the net book value relates to the four (2012 five) largest owned and leased hotels (in terms
of net book value) of a total of 12 hotels (2012 10 hotels), nine of which are open (2012 10 open). There were three hotels acquired during
the year for $70m which are under conversion, not yet in use and therefore not being depreciated.
The carrying value of property, plant and equipment held under finance leases at 31 December 2013 was $187m (2012 $187m).
Including assets classified as held for sale, 55% (2012 43%) of hotel properties by net book value were directly owned, with 39% (201254%)
held under leases having a term of 50 years or longer.
All impairment charges and reversals are included within impairment on the face of the Group income statement.
No borrowing costs were capitalised during the current or prior year.
Following the sale of the InterContinental London Park Lane hotel there are no longer charges (2012 $89m) over the Group’s property,
plantandequipment.
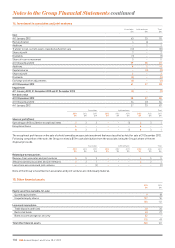
The table below analyses the net book value of the Group’s property, plant and equipment by operating segment at 31 December 2013:
Americas
$m
Europe
$m
AMEA
$m
Greater China
$m
Central
$m
Total
$m
Land and buildings 367 290 8259 21 945
Fixtures, fittings and equipment 33 63 12 48 68 224
400 353 20 307 89 1,169
128 IHG Annual Report and Form 20-F 2013
Notes to the Group Financial Statements continued