Holiday Inn 2013 Annual Report Download - page 182
Download and view the complete annual report
Please find page 182 of the 2013 Holiday Inn annual report below. You can navigate through the pages in the report by either clicking on the pages listed below, or by using the keyword search tool below to find specific information within the annual report.-
 1
1 -
2
-
3
-
4
-
5
-
6
-
7
-
8
-
9
-
10
-
11
-
12
-
13
-
14
-
15
-
16
-
17
-
18
-
19
-
20
-
21
-
22
-
23
-
24
-
25
-
26
-
27
-
28
-
29
-
30
-
31
-
32
-
33
-
34
-
35
-
36
-
37
-
38
-
39
-
40
-
41
-
42
-
43
-
44
-
45
-
46
-
47
-
48
-
49
-
50
-
51
-
52
-
53
-
54
-
55
-
56
-
57
-
58
-
59
-
60
-
61
-
62
-
63
-
64
-
65
-
66
-
67
-
68
-
69
-
70
-
71
-
72
-
73
-
74
-
75
-
76
-
77
-
78
-
79
-
80
-
81
-
82
-
83
-
84
-
85
-
86
-
87
-
88
-
89
-
90
-
91
-
92
-
93
-
94
-
95
-
96
-
97
-
98
-
99
-
100
-
101
-
102
-
103
-
104
-
105
-
106
-
107
-
108
-
109
-
110
-
111
-
112
-
113
-
114
-
115
-
116
-
117
-
118
-
119
-
120
-
121
-
122
-
123
-
124
-
125
-
126
-
127
-
128
-
129
-
130
-
131
-
132
-
133
-
134
-
135
-
136
-
137
-
138
-
139
-
140
-
141
-
142
-
143
-
144
-
145
-
146
-
147
-
148
-
149
-
150
-
151
-
152
-
153
-
154
-
155
-
156
-
157
-
158
-
159
-
160
-
161
-
162
-
163
-
164
-
165
-
166
-
167
-
168
-
169
-
170
-
171
-
 172
172 -
 173
173 -
 174
174 -
 175
175 -
 176
176 -
 177
177 -
 178
178 -
 179
179 -
 180
180 -
 181
181 -
 182
182 -
 183
183 -
 184
184 -
 185
185 -
 186
186 -
 187
187 -
 188
188 -
 189
189 -
 190
190 -
 191
191 -
 192
192
 |
 |
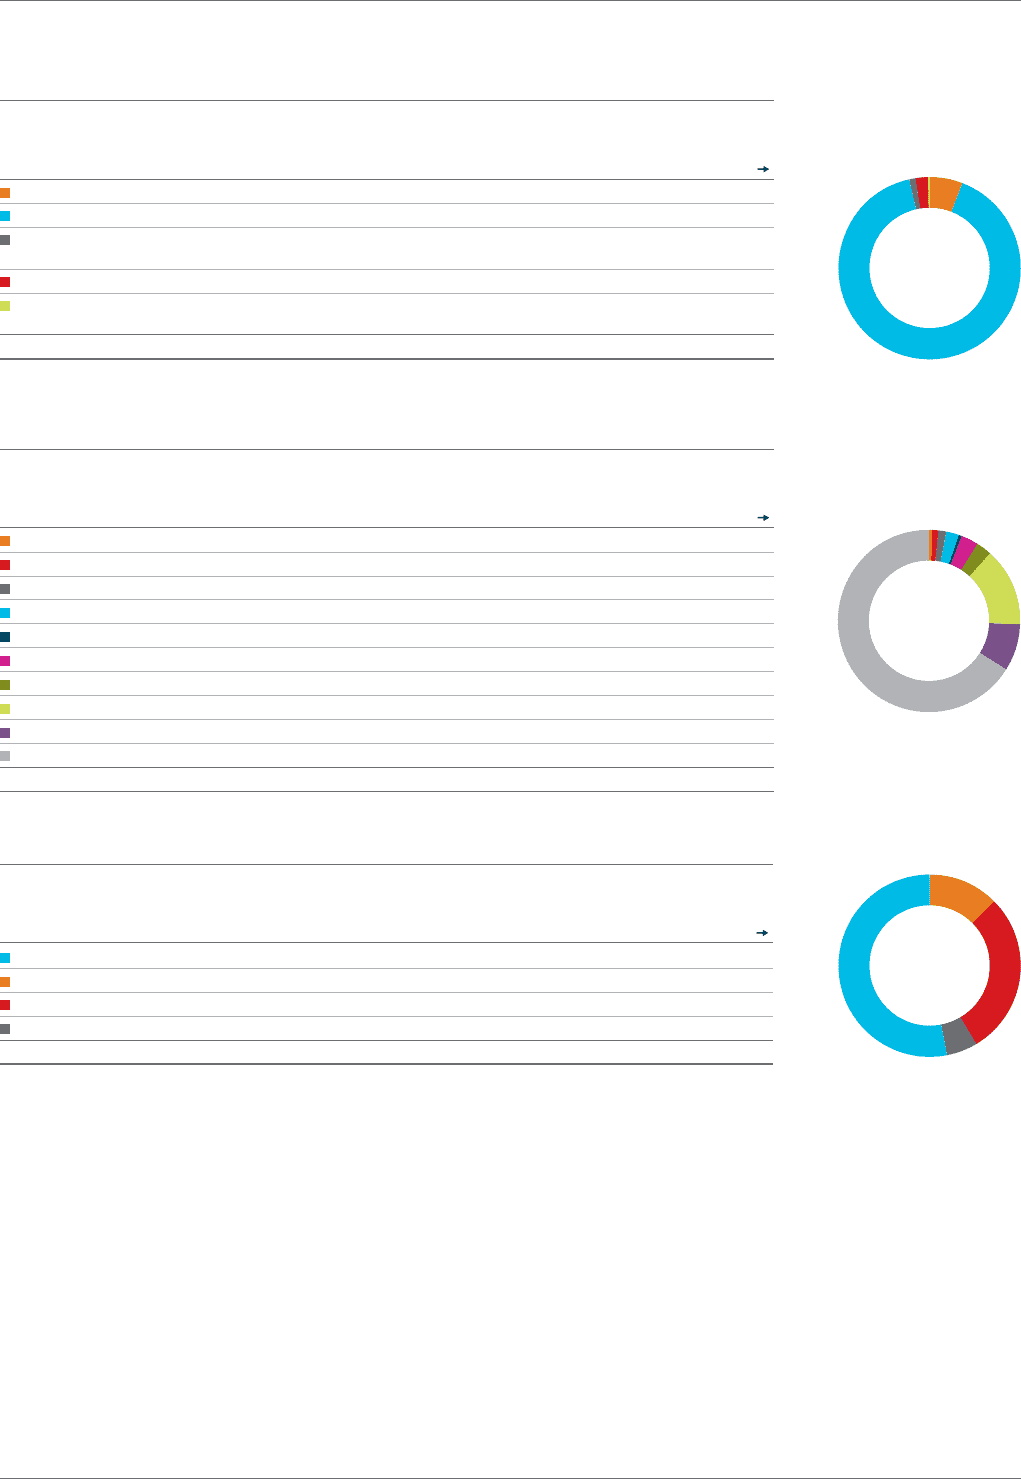
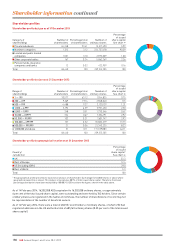
Shareholder profiles
Shareholder profile by type as at 31 December 2013
Category of
shareholdings
Number of
shareholders
Percentage total
of shareholders
Number of
ordinary shares
Percentage
of issued
share capital
See chart
Private individuals 45,248 93.41 15,517,490 5.99
Nominee companies 1,512 3.12 234,757,478 90.59
Limited and public limited
companies 1,501 3.10 2,595,009 1.00
Other corporate bodies 167 0.34 5,862,369 2.26
Pension funds, insurance
companies and banks 12 0.02 422,959 0.16
Total 48,440 100 259,155,305 100
Shareholder profile by size as at 31 December 2013
Range of
shareholdings
Number of
shareholders
Percentage total
of shareholders
Number of
ordinary shares
Percentage
of issued
share capital
See chart
1 — 199 30,577 63.12 1,954,825 0.75
200 — 499 9,269 19.14 2,968,040 1.15
500 — 999 4,488 9.27 3,130,129 1.21
1,000 — 4,999 3,192 6.59 5,951,430 2.30
5,000 — 9,999 248 0.51 1,730,546 0.67
10,000 — 49,999 324 0.67 7,556,191 2.92
50, 000 — 99,999 103 0.21 7,601,747 2.93
100,000 — 499,999 157 0.32 35,582,279 13.73
500,000 — 999,999 31 0.06 21,340,235 8.23
1,000,000 and above 51 0.11 171,339,883 66.11
Total 48,440 100 259,155,305 100
Shareholder profile by geographical location as at 31 December 2013
Country/
Jurisdiction
Percentage
of issued
share capital1
See chart
UK 53.3
Rest of Europe 12.4
US (including ADRs) 29.0
Rest of World 5.3
Total 100
1
The geographical profile presented is based on an analysis of shareholders (by manager) of 40,000 shares or above where
geographical ownership is known. This analysis only captures 88.9% of total issued share capital. Therefore, the known
percentagedistributions have been multiplied by 100⁄88.9 (1.125) to achieve the figures shown in the table above.
As of 14 February 2014, 16,302,058 ADSs equivalent to 16,302,058 ordinary shares, or approximately
6 per cent of the total issued share capital, were outstanding and were held by 762 holders. Since certain
ordinary shares are registered in the names of nominees, the number of shareholders of record may not
be representative of the number of beneficialowners.
As of 14 February 2014, there were a total of 48,255 record holders of ordinary shares, of whom 252 had
registered addresses in the US and held a total of 685,165 ordinary shares (0.25 per cent of the total issued
share capital).
180 IHG Annual Report and Form 20-F 2013
Shareholder information continued