Holiday Inn 2013 Annual Report Download - page 151
Download and view the complete annual report
Please find page 151 of the 2013 Holiday Inn annual report below. You can navigate through the pages in the report by either clicking on the pages listed below, or by using the keyword search tool below to find specific information within the annual report.-
 1
1 -
2
-
3
-
4
-
5
-
6
-
7
-
8
-
9
-
10
-
11
-
12
-
13
-
14
-
15
-
16
-
17
-
18
-
19
-
20
-
21
-
22
-
23
-
24
-
25
-
26
-
27
-
28
-
29
-
30
-
31
-
32
-
33
-
34
-
35
-
36
-
37
-
38
-
39
-
40
-
41
-
42
-
43
-
44
-
45
-
46
-
47
-
48
-
49
-
50
-
51
-
52
-
53
-
54
-
55
-
56
-
57
-
58
-
59
-
60
-
61
-
62
-
63
-
64
-
65
-
66
-
67
-
68
-
69
-
70
-
71
-
72
-
73
-
74
-
75
-
76
-
77
-
78
-
79
-
80
-
81
-
82
-
83
-
84
-
85
-
86
-
87
-
88
-
89
-
90
-
91
-
92
-
93
-
94
-
95
-
96
-
97
-
98
-
99
-
100
-
101
-
102
-
103
-
104
-
105
-
106
-
107
-
108
-
109
-
110
-
111
-
112
-
113
-
114
-
115
-
116
-
117
-
118
-
119
-
120
-
121
-
122
-
123
-
124
-
125
-
126
-
127
-
128
-
129
-
130
-
131
-
132
-
133
-
134
-
135
-
136
-
137
-
138
-
139
-
140
-
 141
141 -
 142
142 -
 143
143 -
 144
144 -
 145
145 -
 146
146 -
 147
147 -
 148
148 -
 149
149 -
 150
150 -
 151
151 -
 152
152 -
 153
153 -
 154
154 -
 155
155 -
 156
156 -
 157
157 -
 158
158 -
 159
159 -
 160
160 -
 161
161 -
162
-
163
-
164
-
165
-
166
-
167
-
168
-
169
-
170
-
171
-
172
-
173
-
174
-
175
-
176
-
177
-
178
-
179
-
180
-
181
-
182
-
183
-
184
-
185
-
186
-
187
-
188
-
189
-
190
-
191
-
192
 |
 |

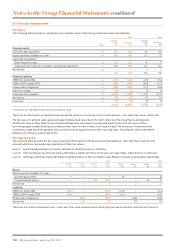
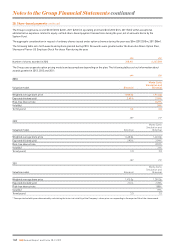
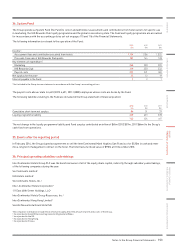
28. Share-based payments continued
Movements in the awards and options outstanding under the schemes are as follows:
APP
Number of
shares
thousands
LTIP
Number of
shares
thousands
Outstanding at 1 January 2011 1,274 11,342
Granted 528 3,257
Vested (702) (3,454)
Lapsed or cancelled (150) (2,115)
Outstanding at 31 December 2011 950 9,030
Granted 341 2,699
Vested (643) (2,621)
Share capital consolidation (18) –
Lapsed or cancelled (8) (1,948)
Outstanding at 31 December 2012 622 7,160
Granted 319 2,227
Vested (72) (2,206)
Lapsed or cancelled (29) (406)
Outstanding at 31 December 2013 840 6,775
Fair value of awards granted during the year
2013 2,873.4¢ 1,127.9¢
2012 2,199.8¢ 792.5¢
2011 2,141.1¢ 819.7¢
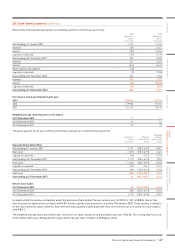
Weighted average remaining contract life (years)
At 31 December 2013 1.1 1.1
At 31 December 2012 1.6 1.2
At 31 December 2011 0.9 1.0
The above awards do not vest until the performance and service conditions have been met.
Number of
shares
thousands
Range of
option prices
pence
Weighted
average
option price
pence
Executive Share Option Plan
Outstanding at 1 January 2011 3,291 308.5-619.8 489.3
Exercised (1,075) 308.5-619.8 476.5
Lapsed or cancelled (46) 422.8 422.8
Outstanding at 31 December 2011 2,170 308.5-619.8 497.0
Exercised (1,365) 308.5-619.8 492.8
Lapsed or cancelled (107) 434.2 434.2
Outstanding at 31 December 2012 698 438.0-619.8 514.8
Exercised (638) 438.0-619.8 512.3
Outstanding at 31 December 2013 60 494.2-619.8 541.3
Options exercisable
At 31 December 2013 60 494.2–619.8 541.3
At 31 December 2012 698 438.0–619.8 514.8
At 31 December 2011 2,170 308.5–619.8 497.0
Included within the options outstanding under the Executive Share Option Plan are options over nil (2012 nil, 2011 458,814) shares that
have not been recognised in accordance with IFRS 2 as the options were granted on or before 7 November 2002. These options, relating to
former Six Continents share schemes, have not been subsequently modified and therefore do not need to be accounted for in accordance
with IFRS 2.
The weighted average share price at the date of exercise for share options vested during the year was 1,934.9p. The closing share price on
31December 2013 was 2,013.0p and the range during the year was 1,737.0p to 2,039.0p per share.
Notes to the Group Financial Statements 149
OVERVIEW STRATEGIC REPORT GOVERNANCE
GROUP
FINANCIAL STATEMENTS
PARENT COMPANY
FINANCIAL STATEMENTS ADDITIONAL INFORMATION