Holiday Inn 2013 Annual Report Download - page 48
Download and view the complete annual report
Please find page 48 of the 2013 Holiday Inn annual report below. You can navigate through the pages in the report by either clicking on the pages listed below, or by using the keyword search tool below to find specific information within the annual report.-
 1
1 -
2
-
3
-
4
-
5
-
6
-
7
-
8
-
9
-
10
-
11
-
12
-
13
-
14
-
15
-
16
-
17
-
18
-
19
-
20
-
21
-
22
-
23
-
24
-
25
-
26
-
27
-
28
-
29
-
30
-
31
-
32
-
33
-
34
-
35
-
36
-
37
-
 38
38 -
 39
39 -
 40
40 -
 41
41 -
 42
42 -
 43
43 -
 44
44 -
 45
45 -
 46
46 -
 47
47 -
 48
48 -
 49
49 -
 50
50 -
 51
51 -
 52
52 -
 53
53 -
 54
54 -
 55
55 -
 56
56 -
 57
57 -
 58
58 -
59
-
60
-
61
-
62
-
63
-
64
-
65
-
66
-
67
-
68
-
69
-
70
-
71
-
72
-
73
-
74
-
75
-
76
-
77
-
78
-
79
-
80
-
81
-
82
-
83
-
84
-
85
-
86
-
87
-
88
-
89
-
90
-
91
-
92
-
93
-
94
-
95
-
96
-
97
-
98
-
99
-
100
-
101
-
102
-
103
-
104
-
105
-
106
-
107
-
108
-
109
-
110
-
111
-
112
-
113
-
114
-
115
-
116
-
117
-
118
-
119
-
120
-
121
-
122
-
123
-
124
-
125
-
126
-
127
-
128
-
129
-
130
-
131
-
132
-
133
-
134
-
135
-
136
-
137
-
138
-
139
-
140
-
141
-
142
-
143
-
144
-
145
-
146
-
147
-
148
-
149
-
150
-
151
-
152
-
153
-
154
-
155
-
156
-
157
-
158
-
159
-
160
-
161
-
162
-
163
-
164
-
165
-
166
-
167
-
168
-
169
-
170
-
171
-
172
-
173
-
174
-
175
-
176
-
177
-
178
-
179
-
180
-
181
-
182
-
183
-
184
-
185
-
186
-
187
-
188
-
189
-
190
-
191
-
192
 |
 |

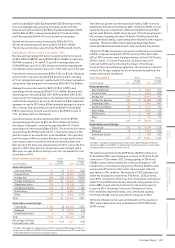
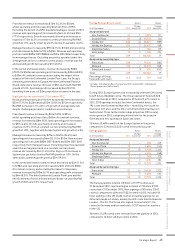
AMEA results 12 months ended 31 December
2013
$m
2012
$m
2013 vs
2012 %
change
2011
$m
2012 vs
2011 %
change
Revenue
Franchised 16 18 (11.1) 19 (5.3)
Managed 170 152 11.8 151 0.7
Owned and leased 44 48 (8.3) 46 4.3
Total 230 218 5.5 216 0.9
Percentage of
Group Revenue 12.1 11.9 0.2 12.2 (0.3)
Operating profit before
exceptional items
Franchised 12 12 –12 –
Managed 92 90 2.2 87 3.4
Owned and leased 46(33.3) 520.0
108 108 –104 3.8
Regional overheads (22) (20) (10.0) (20) –
Total 86 88 (2.3) 84 4.8
Percentage of Group
Operating profit before
central overheads and
exceptional items
10.4 11.5 (1.1) 12.0 (0.5)
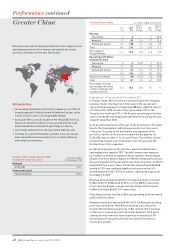
Highlights for the year ended 31December 2013
In AMEA, 81% of rooms are operated under the managed business
model. The region’s hotels are in the luxury, upscale and upper
midscale segments. Comprising 244 hotels (64,838 rooms) at
31December 2013, AMEA represented 9% of the Group’s room
count and 10% of the Group’s operating profit before central
overheads and exceptional operating items during the year
ended 31December 2013.
The number of hotels open in the region increased by 12 in 2013
reflecting delivery against the key priorities of growing the
distribution of our core brands and strengthening our position in
key strategic markets. The openings included the InterContinental
in Osaka and five hotels in India – overall openings totalled 20
hotels against 16 in 2012. Signings into the pipeline remained at
2012 levels which should provide a strong growth platform.
Revenue increased by $12m (5.5%) to $230m and operating profit
decreased by $2m (2.3%) to $86m. On an underlying basis, revenue
and operating profit decreased by $6m (2.8%) and $7m (8.0%)
respectively. The results included a $6m benefit from liquidated
damages in 2013. RevPAR increased by 6.1%, with 3.0% growth
in average daily rate. AMEA is a geographically diverse region and
performance is impacted by political and economic factors affecting
different countries. The Middle East delivered RevPAR growth of
2.9%, driven by strength in the United Arab Emirates and Saudi
Arabia, though continuing political uncertainty impacted some of
our other markets in the region, particularly Egypt and Lebanon.
Performance in Japan was strong, with RevPAR increasing by 9.6%,
whilst Australia also achieved solid RevPAR growth of 2.8%.
RevPAR growth in developing markets remained buoyant, led by
12.2% RevPAR growth in Indonesia. Revenue and operating profit
growth were muted by a $6m negative year-on-year impact from
the renewal of a small number of long-standing contracts onto
current commercial terms. In addition, there was a $4m negative
impact from similar contracts that were not renewed.
Franchised revenue decreased by $2m (11.1%) to $16m,
whilst operating profit was flat at $12m.
Managed revenue and operating profit increased by $18m (11.8%) to
$170m and by $2m (2.2%) to $92m respectively. During 2013, a new
property opened under an operating lease structure, with the same
characteristics as a management contract, contributing revenue of
2014 priorities
• Build preferred brands and strengthen our position in priority
markets and key gateway cities;
• accelerate growth of our core brands across the region with
a particular focus on emerging markets;
• expand our portfolio of brands, including continuing to
accelerate the growth of the Holiday Inn Express brand; and
• continue to deliver operational excellence to improve
guest satisfaction and deliver high-quality revenues by
embedding our revenue tools, system delivery platforms,
responsible business practices and People Tools built upon
high performance winning culture.
Execute our strategic plans to strengthen our brands and
increase our revenue share through operational excellence
and outperformance over the next three years.
AMEA comparable RevPAR movement
onprevious year 12 months ended
31 December 2013
Franchised
All brands 9.6%
Managed
All brands 5.6%
Performance continued
46 IHG Annual Report and Form 20-F 2013
Asia, Middle East
andAfrica (AMEA)