Holiday Inn 2013 Annual Report Download - page 43
Download and view the complete annual report
Please find page 43 of the 2013 Holiday Inn annual report below. You can navigate through the pages in the report by either clicking on the pages listed below, or by using the keyword search tool below to find specific information within the annual report.-
 1
1 -
2
-
3
-
4
-
5
-
6
-
7
-
8
-
9
-
10
-
11
-
12
-
13
-
14
-
15
-
16
-
17
-
18
-
19
-
20
-
21
-
22
-
23
-
24
-
25
-
26
-
27
-
28
-
29
-
30
-
31
-
32
-
 33
33 -
 34
34 -
 35
35 -
 36
36 -
 37
37 -
 38
38 -
 39
39 -
 40
40 -
 41
41 -
 42
42 -
 43
43 -
 44
44 -
 45
45 -
 46
46 -
 47
47 -
 48
48 -
 49
49 -
 50
50 -
 51
51 -
 52
52 -
 53
53 -
54
-
55
-
56
-
57
-
58
-
59
-
60
-
61
-
62
-
63
-
64
-
65
-
66
-
67
-
68
-
69
-
70
-
71
-
72
-
73
-
74
-
75
-
76
-
77
-
78
-
79
-
80
-
81
-
82
-
83
-
84
-
85
-
86
-
87
-
88
-
89
-
90
-
91
-
92
-
93
-
94
-
95
-
96
-
97
-
98
-
99
-
100
-
101
-
102
-
103
-
104
-
105
-
106
-
107
-
108
-
109
-
110
-
111
-
112
-
113
-
114
-
115
-
116
-
117
-
118
-
119
-
120
-
121
-
122
-
123
-
124
-
125
-
126
-
127
-
128
-
129
-
130
-
131
-
132
-
133
-
134
-
135
-
136
-
137
-
138
-
139
-
140
-
141
-
142
-
143
-
144
-
145
-
146
-
147
-
148
-
149
-
150
-
151
-
152
-
153
-
154
-
155
-
156
-
157
-
158
-
159
-
160
-
161
-
162
-
163
-
164
-
165
-
166
-
167
-
168
-
169
-
170
-
171
-
172
-
173
-
174
-
175
-
176
-
177
-
178
-
179
-
180
-
181
-
182
-
183
-
184
-
185
-
186
-
187
-
188
-
189
-
190
-
191
-
192
 |
 |

In May 2013, the Group completed the disposal of its leasehold
interest in the InterContinental London Park Lane and on 19
December 2013, announced the disposal of an 80% interest in the
InterContinental New York Barclay for gross proceeds of $240m,
with IHG holding the remaining 20% interest. The transaction is
expected to be completed in the first quarter of 2014. The Group has
secured a 30-year management contract on the hotel, with two
10-year extension rights at IHG’s discretion.
In February 2014, the Group signed an agreement to sell the
InterContinental Mark Hopkins San Francisco for $120m in cash and
enter into a long-term management contract on the hotel. The hotel
had a net book value of $90m at 31 December 2013.
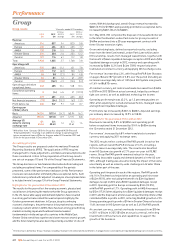
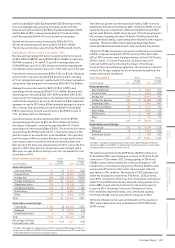
Global pipeline Hotels Rooms
At 31 December 2013
Change
over 2012 2013
Change
over 2012
Analysed by brand
InterContinental 51 316,860 1,147
Crowne Plaza 94 (4) 28,369 (2,814)
Holiday Inn1264 21 50,241 5,253
Holiday Inn Express 473 21 54,744 2,984
Staybridge Suites 80 98,728 1,18 4
Candlewood Suites 80 26,914 172
Hotel Indigo 51 46,807 938
EVEN Hotels 54880 650
HUALUXE 21 66,804 1,900
Other 11114 17
Total 1,120 67 180,461 11,4 31
Analysed by ownership type
Franchised 778 34 86,785 3,884
Managed 339 30 93,176 7,047
Owned and leased 33500 500
Total 1,120 67 180,461 11,4 31
Global pipeline signings 444 88 65,461 11,6 49
1
Includes 1 Holiday Inn Club Vacations (120 rooms) and 14 Holiday Inn
Resortproperties (3,163 rooms) (2012: Includes nil Holiday Inn Club Vacations
(nil rooms) and 12 Holiday Inn Resort properties (2,390 rooms)).
At the end of 2013, the global pipeline totalled 1,120 hotels
(180,461 rooms), an increase of 67 hotels (11,431 rooms) on
31 December 2012. The IHG pipeline represents hotels where
a contract has been signed and the appropriate fees paid.
The continued global demand for IHG brands is demonstrated by
the Group signing hotels in 38 different countries and territories in
2013, 40% of which were in developing markets. 51% of the closing
pipeline at 31 December 2013 was in developing markets, up by one
percentage point compared to the previous year, including 30% in
Greater China. More than 45% of the pipeline is under construction.
Excluding 35 hotels (4,118 rooms) signed as part of the US
government’s PAL initiative, signings increased from 356 hotels
(53,812 rooms) to 409 hotels (61,343 rooms) in 2013. This included
280 hotels (39,555 rooms) in the Holiday Inn brand family, up by
22.7% compared to 2012. More than half of this growth was
contributed by Greater China, with signings increasing by 4,121
rooms to 7,343 rooms. The Greater China region signed a further
27 hotels (8,005 rooms) across other IHG brands, including the
1,002-room Holiday Inn Express Changbaishan, whilst the pipeline
for HUALUXE Hotels & Resorts increased to 21 hotels (6,804
rooms). Four EVEN Hotels (644 rooms), of which three are owned
and leased, were signed in The Americas, with the pipeline for this
brand standing at five hotels (880 rooms) at the end of 2013. Active
management out of the pipeline of deals that have become dormant
or no longer viable reduced the pipeline by 18,563 rooms, compared
to 31,344 rooms in 2012.
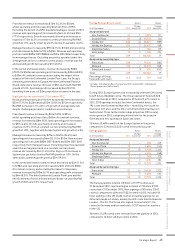
Global total gross revenue 12 months ended 31 December
2013
$bn
2012
$bn % change
InterContinental 4.5 4.5 –
Crowne Plaza 4.0 4.0 –
Holiday Inn 6.2 6.3 (1.6)
Holiday Inn Express 5.2 4.8 8.3
Staybridge Suites 0.6 0.6 –
Candlewood Suites 0.6 0.5 20.0
Hotel Indigo 0.2 0.2 –
Other 0.3 0.3 –
Total 21.6 21.2 1.9
One measure of IHG System performance is the growth in total
gross revenue, defined as total room revenue from franchised
hotels and total hotel revenue from managed, owned and leased
hotels. Total gross revenue is not revenue attributable to IHG,
as it is derived mainly from hotels owned by third parties.
Total gross revenue increased by 1.9% (2.8% increase at constant
currency) to $21.6bn. Total gross revenue for Holiday Inn decreased
by $0.1bn (1.6%), primarily because the number of rooms open under
the brand fell by 6,911, driven by the removal of 10,933 rooms in the
US reflecting the Group’s ongoing focus on quality.
Global hotel and room count Hotels Rooms
At 31 December 2013
Change
over 2012 2013
Change
over 2012
Analysed by brand
InterContinental 178 860,103 2,789
Crowne Plaza 391 (1) 108,891 584
Holiday Inn11,216 (31) 224,577 (6,911)
Holiday Inn Express 2,258 66 214,597 8,966
Staybridge Suites 196 721,518 822
Candlewood Suites 312 13 29,778 1,103
Hotel Indigo 55 56,199 538
Other 91 28 21,210 3,000
Total 4,697 95 686,873 10,891
Analysed by ownership type
Franchised 3,977 43 502,187 1,395
Managed 711 53 180,724 9,726
Owned and leased 9(1) 3,962 (230)
Total 4,697 95 686,873 10,891
1
Includes 10 Holiday Inn Club Vacations (3,701 rooms) and 38 Holiday Inn Resort
properties (8,818 rooms) (2012: 10 Holiday Inn Club Vacations (3,701rooms) and
37 Holiday Inn Resort properties (8,806 rooms)).
During 2013, the global IHG System (the number of hotels and
rooms which are franchised, managed, owned or leased by the
Group) increased by 95 hotels (10,891 rooms).
The Group continued to expand its global footprint, opening hotels
in 33 different countries and territories. More than a third of 2013
openings were in developing markets, as classified by The World
Bank, with 21% of the closing rooms balance located in these
markets, representing an increase of two percentage points from
31 December 2012. Removals of 142 hotels (24,576 rooms) increased
from the previous year (104 hotels, 16,288 rooms) reflecting the
Group’s ongoing focus on improving the quality of the estate.
Openings of 237 hotels (35,467 rooms) were 4.6% higher than
in 2012. This included 115 hotels (12,448 rooms) in the Holiday Inn
brand family in The Americas and 33 hotels (4,061 rooms) as part
of the US government’s Privatisation of Army Lodgings (PAL)
initiative. 23 hotels (7,669 rooms) were opened in Greater China
across five brands in 2013, up 1.1% from last year, with the Europe
and AMEA regions contributing openings of 21 hotels (3,528 rooms)
and 20 hotels (4,495 rooms) respectively.
Strategic Report 41
OVERVIEW STRATEGIC REPORT GOVERNANCE
GROUP
FINANCIAL STATEMENTS
PARENT COMPANY
FINANCIAL STATEMENTS ADDITIONAL INFORMATION