Holiday Inn 2013 Annual Report Download - page 41
Download and view the complete annual report
Please find page 41 of the 2013 Holiday Inn annual report below. You can navigate through the pages in the report by either clicking on the pages listed below, or by using the keyword search tool below to find specific information within the annual report.-
 1
1 -
2
-
3
-
4
-
5
-
6
-
7
-
8
-
9
-
10
-
11
-
12
-
13
-
14
-
15
-
16
-
17
-
18
-
19
-
20
-
21
-
22
-
23
-
24
-
25
-
26
-
27
-
28
-
29
-
30
-
 31
31 -
 32
32 -
 33
33 -
 34
34 -
 35
35 -
 36
36 -
 37
37 -
 38
38 -
 39
39 -
 40
40 -
 41
41 -
 42
42 -
 43
43 -
 44
44 -
 45
45 -
 46
46 -
 47
47 -
 48
48 -
 49
49 -
 50
50 -
 51
51 -
52
-
53
-
54
-
55
-
56
-
57
-
58
-
59
-
60
-
61
-
62
-
63
-
64
-
65
-
66
-
67
-
68
-
69
-
70
-
71
-
72
-
73
-
74
-
75
-
76
-
77
-
78
-
79
-
80
-
81
-
82
-
83
-
84
-
85
-
86
-
87
-
88
-
89
-
90
-
91
-
92
-
93
-
94
-
95
-
96
-
97
-
98
-
99
-
100
-
101
-
102
-
103
-
104
-
105
-
106
-
107
-
108
-
109
-
110
-
111
-
112
-
113
-
114
-
115
-
116
-
117
-
118
-
119
-
120
-
121
-
122
-
123
-
124
-
125
-
126
-
127
-
128
-
129
-
130
-
131
-
132
-
133
-
134
-
135
-
136
-
137
-
138
-
139
-
140
-
141
-
142
-
143
-
144
-
145
-
146
-
147
-
148
-
149
-
150
-
151
-
152
-
153
-
154
-
155
-
156
-
157
-
158
-
159
-
160
-
161
-
162
-
163
-
164
-
165
-
166
-
167
-
168
-
169
-
170
-
171
-
172
-
173
-
174
-
175
-
176
-
177
-
178
-
179
-
180
-
181
-
182
-
183
-
184
-
185
-
186
-
187
-
188
-
189
-
190
-
191
-
192
 |
 |
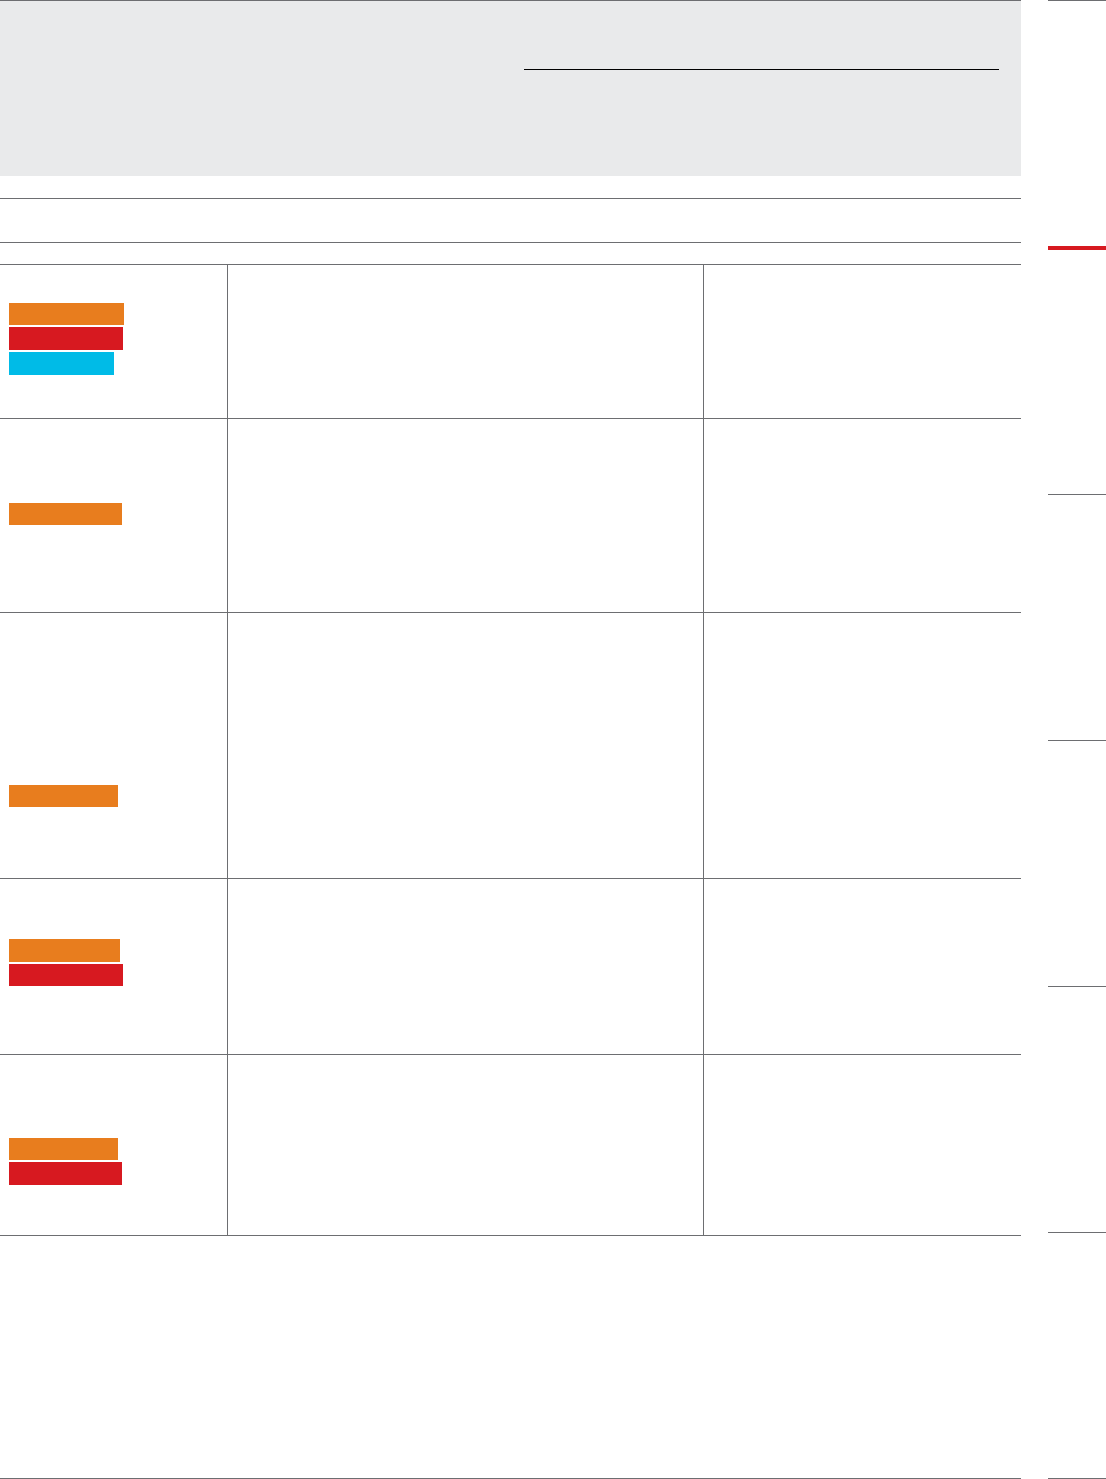
KPIs used to assess performance measures for
remunerationplans:
1 Annual incentive plan (Annual Performance Plan)
2 Long-term incentive plan (Long Term Incentive Plan)
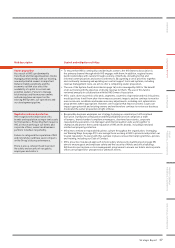
Disciplined Execution
KPIs 2013 progress 2014 priorities
Fee margins1• Group fee margins of 43.2%, up 1.3 percentage points on 2012,
with scale benefits and cost efficiencies more than offsetting
increased investment for future growth.
• Continue to focus on sustainable
fee margin progression over the
medium-term.
Number of people
participating in IHG
Academy programmes
• Opened a further 144 IHG Academy programmes, taking the
total to 301, with 6,391 participants in 2013 helping us to build
a strong pipeline of talent for the future.
• Continue to expand the IHG Academy
throughout our hotel estate making
sure the programmes deliver positive
and transformational results for
participants and IHG.
• Provide skills and improved
employability to a total of 20,000
people via IHG Academy over the
five-year period (2013-2017).
Value of monetary
donations and in-kind
support to communities
by IHG, including funds
deployed through IHG
Shelter in a Storm
Programme
• Contributed a total of $1.92m in 2013 to communities through
monetary donations and in-kind support, including funds
deployed through the IHG Shelter in a Storm Programme.
• $1.2m raised for the IHG Shelter Fund.
• Responded to 15 disasters in 8 countries, including super
typhoon Haiyan in the Philippines, floods in Jakarta,
Buenos Aires, Canada and Mexico, tornadoes in mid-west
America and wildfires in Arizona, by allocating funds to help
with financial support, vital supplies and accommodation.
• Continue to increase awareness of,
and engagement with, the IHG Shelter
in a Storm Programme, ensuring our
hotels are prepared for disaster and
able to respond quickly and effectively
to help the local community and
employees when needed.
• Contribute a total of $10m over a
five-year period (2013-2017) to
communities through monetary
donations and in-kind support,
including funds deployed through the
IHG Shelter in a Storm Programme.
Carbon footprint per
occupied room
• Reduced carbon footprint per occupied room by 31.2kgCO2e
(reduction of 2.4% on 2012 baseline) across our entire estate
• Carbon Disclosure Project disclosure rating of 85B
(the joint highest-scoring hotel company in the FTSE 350,
Standard & Poor’s 500 and Global 500).
• Reduce carbon footprint per occupied
room by 12% across our entire estate
(over a five-year period (2013-2017)
using 2012 baseline).
• Continue to drive quality of use of IHG
Green Engage to reduce impact on the
environment, enable cost savings and
drive revenue.
Water use per occupied
room in water stressed
areas
• Reduced water use per occupied room by 0.56m3 (reduction of
4.6% on 2012 baseline) in water-stressed areas.
• Reduce water use per occupied room
by 12% in water-stressed areas across
our estate (over a five-year period
(2013-2017) using 2012 baseline).
Our regional priorities are set out on pages 42, 44, 46 and 48.
For definitions of each of the above KPIs see the Glossary on pages 186 and 187.
2012
2011
2013
41.9%*
39.5%*
43.2%
*Restated for IAS19R
of Employee Benefits
2013
2012
2011
Not applicable
Not applicable
6,391
2012
2011
2013 $1.92m
2012
2011
Not applicable
Not applicable
2012
2011
2013
32 KgCO²e
31.2 KgCO²e
2011 Not applicable
2012
2011
2013
0.58m³
0.56m³
2011 Not applicable
For more information see Directors’ Remuneration Report
pages 74 to 97.
Strategic Report 39
OVERVIEW STRATEGIC REPORT GOVERNANCE
GROUP
FINANCIAL STATEMENTS
PARENT COMPANY
FINANCIAL STATEMENTS ADDITIONAL INFORMATION