Holiday Inn 2013 Annual Report Download - page 14
Download and view the complete annual report
Please find page 14 of the 2013 Holiday Inn annual report below. You can navigate through the pages in the report by either clicking on the pages listed below, or by using the keyword search tool below to find specific information within the annual report.-
 1
1 -
2
-
3
-
 4
4 -
 5
5 -
 6
6 -
 7
7 -
 8
8 -
 9
9 -
 10
10 -
 11
11 -
 12
12 -
 13
13 -
 14
14 -
 15
15 -
 16
16 -
 17
17 -
 18
18 -
 19
19 -
 20
20 -
 21
21 -
 22
22 -
 23
23 -
 24
24 -
25
-
26
-
27
-
28
-
29
-
30
-
31
-
32
-
33
-
34
-
35
-
36
-
37
-
38
-
39
-
40
-
41
-
42
-
43
-
44
-
45
-
46
-
47
-
48
-
49
-
50
-
51
-
52
-
53
-
54
-
55
-
56
-
57
-
58
-
59
-
60
-
61
-
62
-
63
-
64
-
65
-
66
-
67
-
68
-
69
-
70
-
71
-
72
-
73
-
74
-
75
-
76
-
77
-
78
-
79
-
80
-
81
-
82
-
83
-
84
-
85
-
86
-
87
-
88
-
89
-
90
-
91
-
92
-
93
-
94
-
95
-
96
-
97
-
98
-
99
-
100
-
101
-
102
-
103
-
104
-
105
-
106
-
107
-
108
-
109
-
110
-
111
-
112
-
113
-
114
-
115
-
116
-
117
-
118
-
119
-
120
-
121
-
122
-
123
-
124
-
125
-
126
-
127
-
128
-
129
-
130
-
131
-
132
-
133
-
134
-
135
-
136
-
137
-
138
-
139
-
140
-
141
-
142
-
143
-
144
-
145
-
146
-
147
-
148
-
149
-
150
-
151
-
152
-
153
-
154
-
155
-
156
-
157
-
158
-
159
-
160
-
161
-
162
-
163
-
164
-
165
-
166
-
167
-
168
-
169
-
170
-
171
-
172
-
173
-
174
-
175
-
176
-
177
-
178
-
179
-
180
-
181
-
182
-
183
-
184
-
185
-
186
-
187
-
188
-
189
-
190
-
191
-
192
 |
 |

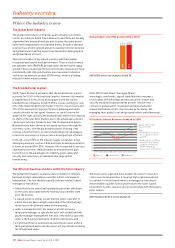
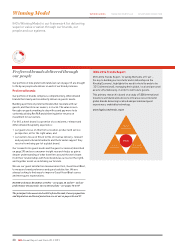
Overall, global industry RevPAR
increased by 4.4% in 2013 and
IHG’s global RevPAR grew
3.8%. As would be anticipated,
performance varied across
regions and across segments
(see page 29), with each facing
different economic, social and
physical conditions.
RevPAR is a KPI – see page 38.
IHG’sperformance globally and in each
of our regions during 2013 is detailed on
pages 40 to 50.
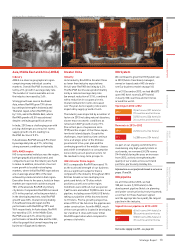
The Americas
Industry
The hotel industry performed strongly in the
region. RevPAR grew by 6.6% with average
daily rate increasing by 5%. On the supply
side, the number of rooms only increased by
0.8%. Although RevPAR growth was strong,
it was not consistent across all segments,
with the luxury, upper upscale and upscale
segments performing best.
The overall dynamic remains favourable
in the US, with industry demand achieving
record highs and supply growth still
below the 2% per annum historic average.
Reflecting this, US RevPAR increased 5.4%
during 2013 with average daily rate growing
3.9% and occupancy also continued to grow.
On a negative note, the US government’s
reduced travel over 2012 and 2013 and
complete shutdown in the fourth quarter
of 2013, meant that some cities, such as
Washington D.C., were impacted. However,
this did not outweigh the positive economic
trends that contributed to greater demand
in the industry.
IHG’s Americas region
IHG’s comparable RevPAR increased
4.3% with 2.6% rate growth. The region
is predominantly represented by the
US, where comparable RevPAR was up
4.2%. Our upscale and luxury brands
(InterContinental, Crowne Plaza and
Hotel Indigo) outperformed the industry.
In the midscale segment, Holiday Inn and
Holiday Inn Express maintained a rate
premium to the segment. However,
RevPAR grew at a lower rate than the
market, reflecting the superior RevPAR
performance versus the market in
recent years and higher absolute
RevPAR. Quality remained a focus,
and 17,968 rooms left the IHG System.
Overall the number of rooms open in
the region increased by 1,807 rooms.
Europe
Industry
Despite continuing challenging economic
conditions in the eurozone, overall the
industry performed well with RevPAR
increasing 3.2% and average daily rate
1.5%. The number of rooms across the
industry increased by only 0.9%. Europe is
a diverse region and the industry figures
were driven by the larger markets, in
particular the UK and Germany.
In the UK, RevPAR grew 3.9%,
predominantly led by occupancy growth,
although average daily rate grew
marginally (0.2%). The UK provinces,
after a relatively protracted period of
weakness, performed particularly well.
London’s RevPAR growth was positive in
2013, despite an unprecedented level of
new rooms and 2012 figures elevated
by the London 2012 Olympic and
Paralympic Games.
Economic growth in Germany has tended to
be more stable in the recent past. Although
RevPAR for Germany did increase by 1.7%,
the industry is highly dependent upon trade
fairs, which are not consistent in number
or size year-on-year. Overall, there were
fewer trade fairs in 2013 compared to 2012
and RevPAR growth was positive but not as
high as the growth seen in 2012.
IHG’s Europe region
IHG’s comparable RevPAR increased 1.7%
led by a 1.5 percentage point increase in
occupancy. RevPAR growth was resilient
in our priority markets, despite tough
comparatives. In London, we outperformed
the market, although across the UK we
were marginally below market. Overall,
comparable UK RevPAR increased by 3%. In
Germany, RevPAR grew 0.8% reflecting
a weaker trade fair calendar in key cities,
particularly Berlin and Dusseldorf.
In France, RevPAR grew 2.6%, with 5.3%
growth at our owned InterContinental
Paris Le Grand.
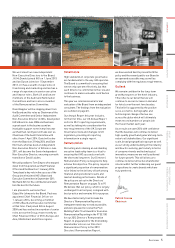
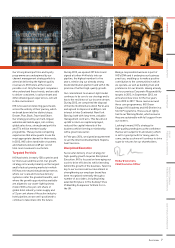
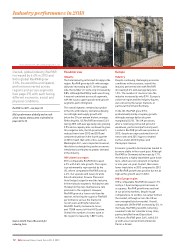
Crowne Plaza Edinburgh – The Roxburghe, UK
InterContinental The Willard Washington D.C., US
Source: Smith Travel Research for
industryfacts.
12 IHG Annual Report and Form 20-F 2013
Industry performance in 2013