Holiday Inn 2013 Annual Report Download - page 119
Download and view the complete annual report
Please find page 119 of the 2013 Holiday Inn annual report below. You can navigate through the pages in the report by either clicking on the pages listed below, or by using the keyword search tool below to find specific information within the annual report.-
 1
1 -
2
-
3
-
4
-
5
-
6
-
7
-
8
-
9
-
10
-
11
-
12
-
13
-
14
-
15
-
16
-
17
-
18
-
19
-
20
-
21
-
22
-
23
-
24
-
25
-
26
-
27
-
28
-
29
-
30
-
31
-
32
-
33
-
34
-
35
-
36
-
37
-
38
-
39
-
40
-
41
-
42
-
43
-
44
-
45
-
46
-
47
-
48
-
49
-
50
-
51
-
52
-
53
-
54
-
55
-
56
-
57
-
58
-
59
-
60
-
61
-
62
-
63
-
64
-
65
-
66
-
67
-
68
-
69
-
70
-
71
-
72
-
73
-
74
-
75
-
76
-
77
-
78
-
79
-
80
-
81
-
82
-
83
-
84
-
85
-
86
-
87
-
88
-
89
-
90
-
91
-
92
-
93
-
94
-
95
-
96
-
97
-
98
-
99
-
100
-
101
-
102
-
103
-
104
-
105
-
106
-
107
-
108
-
 109
109 -
 110
110 -
 111
111 -
 112
112 -
 113
113 -
 114
114 -
 115
115 -
 116
116 -
 117
117 -
 118
118 -
 119
119 -
 120
120 -
 121
121 -
 122
122 -
 123
123 -
 124
124 -
 125
125 -
 126
126 -
 127
127 -
 128
128 -
 129
129 -
130
-
131
-
132
-
133
-
134
-
135
-
136
-
137
-
138
-
139
-
140
-
141
-
142
-
143
-
144
-
145
-
146
-
147
-
148
-
149
-
150
-
151
-
152
-
153
-
154
-
155
-
156
-
157
-
158
-
159
-
160
-
161
-
162
-
163
-
164
-
165
-
166
-
167
-
168
-
169
-
170
-
171
-
172
-
173
-
174
-
175
-
176
-
177
-
178
-
179
-
180
-
181
-
182
-
183
-
184
-
185
-
186
-
187
-
188
-
189
-
190
-
191
-
192
 |
 |

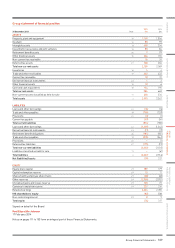
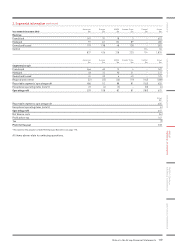
Year ended 31 December 2013
Americas
$m
Europe
$m
AMEA
$m
Greater China
$m
Central
$m
Group
$m
Revenue
Franchised 576 104 16 3 – 699
Managed 128 156 170 92 –546
Owned and leased 212 140 44 141 –537
Central ––––121 121
916 400 230 236 121 1,903
Americas
$m
Europe
$m
AMEA
$m
Greater China
$m
Central
$m
Group
$m
Segmental result
Franchised 499 79 12 5 – 595
Managed 74 30 92 51 –247
Owned and leased 30 30 447 –111
Regional and central (53) (34) (22) (21) (155) (285)
Reportable segments’ operating profit 550 105 86 82 (155) 668
Exceptional operating items (note 5) 619 –(10) (10) 5
Operating profit 556 124 86 72 (165) 673
Group
$m
Reportable segments’ operating profit 668
Exceptional operating items (note 5) 5
Operating profit 673
Net finance costs (73)
Profit before tax 600
Tax (226)
Profit for the year 374
All items above relate to continuing operations.
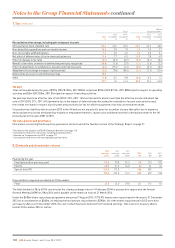
1. Exchange rates
The results of operations have been translated into US dollars at
the average rates of exchange for the year. In the case of sterling,
the translation rate is $1=£0.64 (2012 $1=£0.63, 2011 $1=£0.62).
In the case of the euro, the translation rate is $1=€0.75 (2012
$1=€0.78, 2011 $1=€0.72).
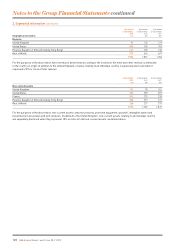
2. Segmental information
The management of the Group’s operations, excluding Central
functions, is organised within four geographical regions:
• Americas;
• Europe;
• Asia, Middle East and Africa (AMEA); and
• Greater China.
These, together with Central functions, comprise the Group’s
five reportable segments. No operating segments have been
aggregated to form these reportable segments.
Central functions include costs of global functions including
technology, sales and marketing, finance, human resources and
corporate services; revenue arises principally from technology
Assets and liabilities have been translated into US dollars at the
rates of exchange on the last day of the year. In the case of sterling,
the translation rate is $1=£0.60 (2012 $1=£0.62, 2011 $1=£0.65).
In the case of the euro, the translation rate is $1=€0.73 (2012
$1=€0.76, 2011 $1=€0.77).
fee income. Central liabilities include the loyalty programme
liability and the cumulative short-term System Fund surplus.
Each of the geographical regions derives its revenues from either
franchising, managing or owning hotels and additional segmental
disclosures are provided accordingly.
Management monitors the operating results of the geographical
regions and Central functions separately for the purpose of making
decisions about resource allocation and performance assessment.
Segmental performance is evaluated based on operating profit or
loss and is measured consistently with operating profit or loss in
the Consolidated Financial Statements, excluding exceptional
items. Group financing activities and income taxes are managed
on a group basis and are not allocated to reportable segments.
Notes to the Group Financial Statements
Notes to the Group Financial Statements 117
OVERVIEW STRATEGIC REPORT GOVERNANCE
GROUP
FINANCIAL STATEMENTS
PARENT COMPANY
FINANCIAL STATEMENTS ADDITIONAL INFORMATION