Holiday Inn 2013 Annual Report Download - page 143
Download and view the complete annual report
Please find page 143 of the 2013 Holiday Inn annual report below. You can navigate through the pages in the report by either clicking on the pages listed below, or by using the keyword search tool below to find specific information within the annual report.-
 1
1 -
2
-
3
-
4
-
5
-
6
-
7
-
8
-
9
-
10
-
11
-
12
-
13
-
14
-
15
-
16
-
17
-
18
-
19
-
20
-
21
-
22
-
23
-
24
-
25
-
26
-
27
-
28
-
29
-
30
-
31
-
32
-
33
-
34
-
35
-
36
-
37
-
38
-
39
-
40
-
41
-
42
-
43
-
44
-
45
-
46
-
47
-
48
-
49
-
50
-
51
-
52
-
53
-
54
-
55
-
56
-
57
-
58
-
59
-
60
-
61
-
62
-
63
-
64
-
65
-
66
-
67
-
68
-
69
-
70
-
71
-
72
-
73
-
74
-
75
-
76
-
77
-
78
-
79
-
80
-
81
-
82
-
83
-
84
-
85
-
86
-
87
-
88
-
89
-
90
-
91
-
92
-
93
-
94
-
95
-
96
-
97
-
98
-
99
-
100
-
101
-
102
-
103
-
104
-
105
-
106
-
107
-
108
-
109
-
110
-
111
-
112
-
113
-
114
-
115
-
116
-
117
-
118
-
119
-
120
-
121
-
122
-
123
-
124
-
125
-
126
-
127
-
128
-
129
-
130
-
131
-
132
-
 133
133 -
 134
134 -
 135
135 -
 136
136 -
 137
137 -
 138
138 -
 139
139 -
 140
140 -
 141
141 -
 142
142 -
 143
143 -
 144
144 -
 145
145 -
 146
146 -
 147
147 -
 148
148 -
 149
149 -
 150
150 -
 151
151 -
 152
152 -
 153
153 -
154
-
155
-
156
-
157
-
158
-
159
-
160
-
161
-
162
-
163
-
164
-
165
-
166
-
167
-
168
-
169
-
170
-
171
-
172
-
173
-
174
-
175
-
176
-
177
-
178
-
179
-
180
-
181
-
182
-
183
-
184
-
185
-
186
-
187
-
188
-
189
-
190
-
191
-
192
 |
 |

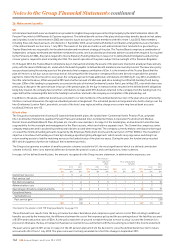
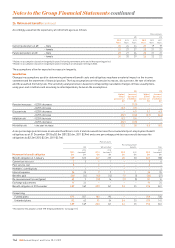
24. Fair value measurement continued
The fair value of quoted equity shares and the bonds is based on their quoted market price.
Derivatives are fair valued using discounted future cash flows, taking into consideration exchange rates prevailing on the last day of
the reporting period and interest rates from observable swap curves. As the Group’s derivatives are not cash collaterised, a valuation
adjustment is made for credit risk, being counterparty risks in respect of derivative assets and own credit risks in respect of derivative
liabilities. At 31 December 2013, the interest rates used to fair value the derivative liabilities ranged from 1.4% to 2.5%, depending on the
currency and the term of the derivative contract.
Finance lease obligations relate to the lease of the InterContinental Boston and are fair valued by discounting the future cash flows
payable under the loan, which are fixed, at a risk adjusted long term interest rate. The interest rate used to discount the cash flows at
31 December 2013 was 8.4% (2012 7.4%).
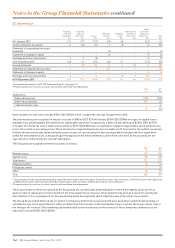
Unquoted equity shares are fair valued using the International Private Equity and Venture Capital Valuation Guidelines either by applying
an average price-earnings (P/E) ratio for a competitor group to the earnings generated by the investment or by reference to share of net
assets if the investment is currently loss-making. The average P/E ratio for the year was 23.9 and anon-marketability factor of 30% is
applied. A 10% increase in the average P/E ratio would result in a $5m increase (2012 $5m) in the fair value of the investments and a 10%
decrease in the average P/E ratio would result in a $5m decrease (2012 $5m) in the fair value of the investments. A 10% increase in net
assets would result in a $5m increase (2012 $2m) in the fair value of the investments and a 10% decrease in net assets would result in a
$5m decrease (2012 $2m) in the fair value of the investments.
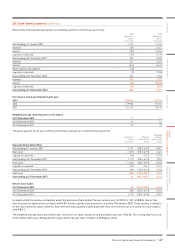
The following table reconciles the movements in the fair values of investments classified as Level 3 during the year:
2013
$m
2012
$m
At 1 January 94 97
Additions 8–
Repaid –(1)
Valuation gains/(losses) recognised in other comprehensive income 25 (2)
At 31 December 127 94
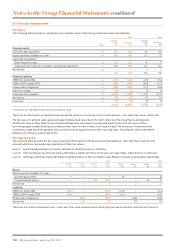
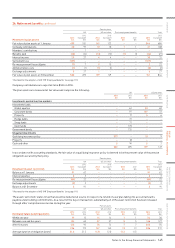
25. Net debt
2013
$m
2012
$m
Cash and cash equivalents 134 195
Loans and other borrowings – current (16) (16)
– non-current (1,269) (1,242)
Derivatives hedging debt values (note 23) (2) (11)
Net debt (1,153) (1,074)
Movement in net debt
Net (decrease)/increase in cash and cash equivalents (58) 15
Add back cash flows in respect of other components of net debt:
Issue of long-term bonds –(632)
Decrease in other borrowings 199
Increase in net debt arising from cash flows (57) (518)
Non-cash movements:
Finance lease obligations (3) (3)
Exchange and other adjustments (19) (15)
Increase in net debt (79) (536)
Net debt at beginning of the year (1,074) (538)
Net debt at end of the year (1,153) (1,074)
Net debt includes the exchange element of the fair value of currency swaps that fix the value of the Group’s £250m 6% bonds at $415m. Anequal
and opposite exchange adjustment on the retranslation of the £250m 6% bonds is included in non-current loans and otherborrowings.
Notes to the Group Financial Statements 141
OVERVIEW STRATEGIC REPORT GOVERNANCE
GROUP
FINANCIAL STATEMENTS
PARENT COMPANY
FINANCIAL STATEMENTS ADDITIONAL INFORMATION