Holiday Inn 2013 Annual Report Download - page 137
Download and view the complete annual report
Please find page 137 of the 2013 Holiday Inn annual report below. You can navigate through the pages in the report by either clicking on the pages listed below, or by using the keyword search tool below to find specific information within the annual report.-
 1
1 -
2
-
3
-
4
-
5
-
6
-
7
-
8
-
9
-
10
-
11
-
12
-
13
-
14
-
15
-
16
-
17
-
18
-
19
-
20
-
21
-
22
-
23
-
24
-
25
-
26
-
27
-
28
-
29
-
30
-
31
-
32
-
33
-
34
-
35
-
36
-
37
-
38
-
39
-
40
-
41
-
42
-
43
-
44
-
45
-
46
-
47
-
48
-
49
-
50
-
51
-
52
-
53
-
54
-
55
-
56
-
57
-
58
-
59
-
60
-
61
-
62
-
63
-
64
-
65
-
66
-
67
-
68
-
69
-
70
-
71
-
72
-
73
-
74
-
75
-
76
-
77
-
78
-
79
-
80
-
81
-
82
-
83
-
84
-
85
-
86
-
87
-
88
-
89
-
90
-
91
-
92
-
93
-
94
-
95
-
96
-
97
-
98
-
99
-
100
-
101
-
102
-
103
-
104
-
105
-
106
-
107
-
108
-
109
-
110
-
111
-
112
-
113
-
114
-
115
-
116
-
117
-
118
-
119
-
120
-
121
-
122
-
123
-
124
-
125
-
126
-
 127
127 -
 128
128 -
 129
129 -
 130
130 -
 131
131 -
 132
132 -
 133
133 -
 134
134 -
 135
135 -
 136
136 -
 137
137 -
 138
138 -
 139
139 -
 140
140 -
 141
141 -
 142
142 -
 143
143 -
 144
144 -
 145
145 -
 146
146 -
 147
147 -
148
-
149
-
150
-
151
-
152
-
153
-
154
-
155
-
156
-
157
-
158
-
159
-
160
-
161
-
162
-
163
-
164
-
165
-
166
-
167
-
168
-
169
-
170
-
171
-
172
-
173
-
174
-
175
-
176
-
177
-
178
-
179
-
180
-
181
-
182
-
183
-
184
-
185
-
186
-
187
-
188
-
189
-
190
-
191
-
192
 |
 |

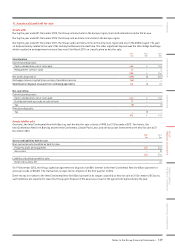
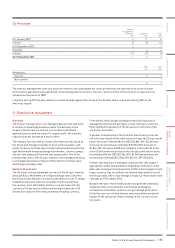
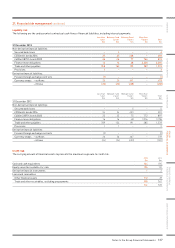
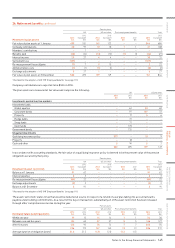
20. Provisions
Onerous
management
contracts
$m
Litigation
$m
Total
$m
At 1 January 2012 311 14
Utilised (1) (11) (12)
At 31 December 2012 2 – 2
Provided – 4 4
Utilised (1) (2) (3)
At 31 December 2013 1 2 3
2013
$m
2012
$m
Analysed as:
Current 31
Non-current –1
32
The onerous management contracts provision relates to the unavoidable net cash outflows that are expected to be incurred under
performance guarantees associated with certain management contracts. The non-current portion of the provision is expected to be
utilised over the period to 2020.
Litigation during 2013 largely relates to actions brought against the Group in the Greater China region and during 2012 in the
Americas region.
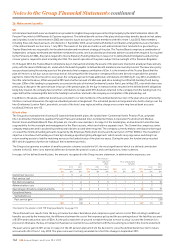
21. Financial risk management
Overview
The Group’s treasury policy is to manage financial risks that arise
in relation to underlying business needs. The activities of the
treasury function are carried out in accordance with Board
approved policies and are subject to regular audit. The treasury
function does not operate as a profit centre.
The treasury function seeks to reduce the financial risks faced by
the Group and manages liquidity to meet all foreseeable cash
needs. Treasury activities may include money market investments,
spot and forward foreign exchange instruments, currency swaps,
interest rate swaps and forward rate agreements. One of the
primary objectives of the Group’s treasury risk management policy
is to mitigate the adverse impact of movements in interest rates
and foreign exchange rates.
Market risk exposure
The US dollar is the predominant currency of the Group’s revenue
andcash flows. Movements in foreign exchange rates can affect
theGroup’s reported profit, net assets and interest cover. To hedge
translation exposure, wherever possible, the Group matches
the currency of its debt (either directly or via derivatives) to the
currency ofits net assets, whilst maximising the amount of US
dollars borrowedto reflect the predominant trading currency.
From time to time, foreign exchange transaction exposure is
managed by the forward purchase or sale of foreign currencies.
Most significant exposures of the Group are in currencies that
are freely convertible.
A general strengthening of the US dollar (specifically a five cent
fall in the sterling:US dollar rate) would increase the Group’s profit
before tax by an estimated $4.1m (2012 $2.8m, 2011 $3.3m) and
increase net assets by an estimated $16.0m (2012 increase of
$1.8m, 2011 decrease of $10.4m). Similarly, a five cent fall in the
euro:US dollar rate would reduce the Group’s profit before tax by
an estimated $2.6m (2012 $2.3m, 2011 $1.9m) and decrease net
assets by an estimated $14.8m (2012 $16.1m, 2011 $10.3m).
Interest rate exposure is managed, using interest rate swaps if
appropriate, within set parameters depending on the term of the
debt, with a minimum fixed proportion of 25% of borrowings for each
major currency. Due to relatively low interest rates and the level of
the Group’s debt, 100% of borrowings in major currencies were fixed
rate debt at 31 December 2013.
Based on the year-end net debt position and given the underlying
maturity profile of investments, borrowings and hedging
instruments atthat date, neither a one percentage point rise in
USdollar, euro nor sterling interest rates would have a material
impact on the annual net interest charge in the current or prior
twoyears.
Notes to the Group Financial Statements 135
OVERVIEW STRATEGIC REPORT GOVERNANCE
GROUP
FINANCIAL STATEMENTS
PARENT COMPANY
FINANCIAL STATEMENTS ADDITIONAL INFORMATION