Holiday Inn 2013 Annual Report Download - page 150
Download and view the complete annual report
Please find page 150 of the 2013 Holiday Inn annual report below. You can navigate through the pages in the report by either clicking on the pages listed below, or by using the keyword search tool below to find specific information within the annual report.-
 1
1 -
2
-
3
-
4
-
5
-
6
-
7
-
8
-
9
-
10
-
11
-
12
-
13
-
14
-
15
-
16
-
17
-
18
-
19
-
20
-
21
-
22
-
23
-
24
-
25
-
26
-
27
-
28
-
29
-
30
-
31
-
32
-
33
-
34
-
35
-
36
-
37
-
38
-
39
-
40
-
41
-
42
-
43
-
44
-
45
-
46
-
47
-
48
-
49
-
50
-
51
-
52
-
53
-
54
-
55
-
56
-
57
-
58
-
59
-
60
-
61
-
62
-
63
-
64
-
65
-
66
-
67
-
68
-
69
-
70
-
71
-
72
-
73
-
74
-
75
-
76
-
77
-
78
-
79
-
80
-
81
-
82
-
83
-
84
-
85
-
86
-
87
-
88
-
89
-
90
-
91
-
92
-
93
-
94
-
95
-
96
-
97
-
98
-
99
-
100
-
101
-
102
-
103
-
104
-
105
-
106
-
107
-
108
-
109
-
110
-
111
-
112
-
113
-
114
-
115
-
116
-
117
-
118
-
119
-
120
-
121
-
122
-
123
-
124
-
125
-
126
-
127
-
128
-
129
-
130
-
131
-
132
-
133
-
134
-
135
-
136
-
137
-
138
-
139
-
 140
140 -
 141
141 -
 142
142 -
 143
143 -
 144
144 -
 145
145 -
 146
146 -
 147
147 -
 148
148 -
 149
149 -
 150
150 -
 151
151 -
 152
152 -
 153
153 -
 154
154 -
 155
155 -
 156
156 -
 157
157 -
 158
158 -
 159
159 -
 160
160 -
161
-
162
-
163
-
164
-
165
-
166
-
167
-
168
-
169
-
170
-
171
-
172
-
173
-
174
-
175
-
176
-
177
-
178
-
179
-
180
-
181
-
182
-
183
-
184
-
185
-
186
-
187
-
188
-
189
-
190
-
191
-
192
 |
 |

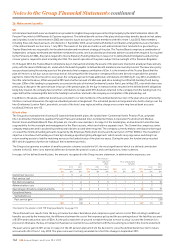
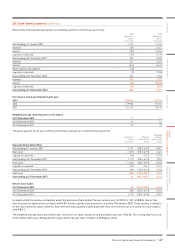
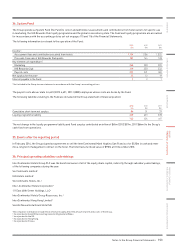
28. Share-based payments continued
The Group recognised a cost of $22m (2012 $22m, 2011 $25m) in operating profit and $nil (2012 $1m, 2011 $nil) within exceptional
administrative expenses related to equity-settled share-based payment transactions during the year, net of amounts borne by the
SystemFund.
The aggregate consideration in respect of ordinary shares issued under option schemes during the year was $5m (2012 $10m, 2011 $8m).
The following table sets forth awards and options granted during 2013. No awards were granted under the Executive Share Option Plan,
SharesavePlan or US Employee Stock Purchase Plan during the year.
APP LTIP
Number of shares awarded in 2013 318,911 2,227,293
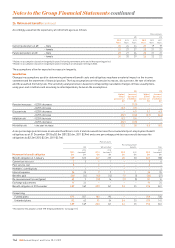
The Group uses separate option pricing models and assumptions depending on the plan. The following tables set out information about
awards granted in 2013, 2012 and 2011:
APP LTIP
2013
Valuation model Binomial
Monte Carlo
Simulation and
Binomial
Weighted average share price 1,928.0p 1,913.0p
Expected dividend yield 2.63% 2.59%
Risk-free interest rate 0.27%
Volatility128%
Term (years) 3.0 3.0
ABP LTIP
2012
Valuation model Binomial
Monte Carlo
Simulation and
Binomial
Weighted average share price 1,440.0p 1,440.0p
Expected dividend yield 2.95% 2.99%
Risk-free interest rate 0.59%
Volatility131%
Term (years) 3.0 3.0
ABP LTIP
2011
Valuation model Binomial
Monte Carlo
Simulation and
Binomial
Weighted average share price 1,415.0p 1,281.0p
Expected dividend yield 2.14% 2.78%
Risk-free interest rate 1.88%
Volatility139%
Term (years) 3.0 3.0
1
The expected volatility was determined by calculating the historical volatility of the Company’s share price corresponding to the expected life of the shareaward.
148 IHG Annual Report and Form 20-F 2013
Notes to the Group Financial Statements continued