Holiday Inn 2013 Annual Report Download - page 136
Download and view the complete annual report
Please find page 136 of the 2013 Holiday Inn annual report below. You can navigate through the pages in the report by either clicking on the pages listed below, or by using the keyword search tool below to find specific information within the annual report.-
 1
1 -
2
-
3
-
4
-
5
-
6
-
7
-
8
-
9
-
10
-
11
-
12
-
13
-
14
-
15
-
16
-
17
-
18
-
19
-
20
-
21
-
22
-
23
-
24
-
25
-
26
-
27
-
28
-
29
-
30
-
31
-
32
-
33
-
34
-
35
-
36
-
37
-
38
-
39
-
40
-
41
-
42
-
43
-
44
-
45
-
46
-
47
-
48
-
49
-
50
-
51
-
52
-
53
-
54
-
55
-
56
-
57
-
58
-
59
-
60
-
61
-
62
-
63
-
64
-
65
-
66
-
67
-
68
-
69
-
70
-
71
-
72
-
73
-
74
-
75
-
76
-
77
-
78
-
79
-
80
-
81
-
82
-
83
-
84
-
85
-
86
-
87
-
88
-
89
-
90
-
91
-
92
-
93
-
94
-
95
-
96
-
97
-
98
-
99
-
100
-
101
-
102
-
103
-
104
-
105
-
106
-
107
-
108
-
109
-
110
-
111
-
112
-
113
-
114
-
115
-
116
-
117
-
118
-
119
-
120
-
121
-
122
-
123
-
124
-
125
-
 126
126 -
 127
127 -
 128
128 -
 129
129 -
 130
130 -
 131
131 -
 132
132 -
 133
133 -
 134
134 -
 135
135 -
 136
136 -
 137
137 -
 138
138 -
 139
139 -
 140
140 -
 141
141 -
 142
142 -
 143
143 -
 144
144 -
 145
145 -
 146
146 -
147
-
148
-
149
-
150
-
151
-
152
-
153
-
154
-
155
-
156
-
157
-
158
-
159
-
160
-
161
-
162
-
163
-
164
-
165
-
166
-
167
-
168
-
169
-
170
-
171
-
172
-
173
-
174
-
175
-
176
-
177
-
178
-
179
-
180
-
181
-
182
-
183
-
184
-
185
-
186
-
187
-
188
-
189
-
190
-
191
-
192
 |
 |

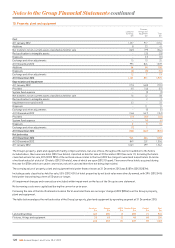
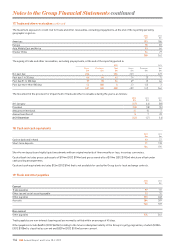
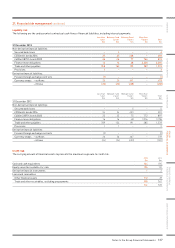
17. Trade and other receivables continued
The maximum exposure to credit risk for trade and other receivables, excluding prepayments, at the end of the reporting period by
geographic region is:
2013
$m
2012
$m
Americas 193 186
Europe 78 83
Asia, Middle East and Africa 53 64
Greater China 34 29
358 362
The ageing of trade and other receivables, excluding prepayments, at the end of the reporting period is:
2013 2012
Gross
$m
Provision
$m
Net
$m
Gross
$m
Provision
$m
Net
$m
Not past due 236 –236 223 –223
Past due 1 to 30 days 66 (4) 62 74 (3) 71
Past due 31 to 180 days 57 (3) 54 69 (3) 66
Past due more than 180 days 42 (36) 643 (41) 2
401 (43) 358 409 (47) 362
The movement in the provision for impairment of trade and other receivables during the year is as follows:
2013
$m
2012
$m
2011
$m
At 1 January (47) (46) (58)
Provided (18) (18) (15)
Amounts written back 14 10 7
Amounts written off 8720
At 31 December (43) (47) (46)
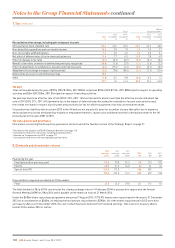
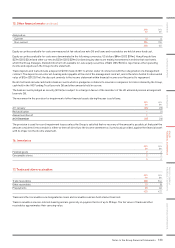
18. Cash and cash equivalents
2013
$m
2012
$m
Cash at bank and in hand 63 57
Short-term deposits 71 138
134 195
Short-term deposits are highly liquid investments with an original maturity of three months or less, in various currencies.
Cash at bank includes gross cash assets of $114m (2012 $194m) and gross overdrafts of $114m (2012 $192m) which are offset under
cash pooling arrangements.
Cash and cash equivalents includes $12m (2012 $7m) that is not available for use by the Group due to local exchange controls.
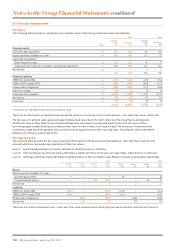
19. Trade and other payables
2013
$m
2012
$m
Current
Trade payables 97 117
Other tax and social security payable 32 35
Other payables 335 268
Accruals 284 289
748 709
Non-current
Other payables 574 563
Trade payables are non-interest-bearing and are normally settled within an average of 45 days.
Other payables include $649m (2012 $623m) relating to the future redemption liability of the Group’s loyalty programme, of which $120m
(2012$108m) is classified as current and $529m (2012 $515m) as non-current.
134 IHG Annual Report and Form 20-F 2013
Notes to the Group Financial Statements continued