Holiday Inn 2013 Annual Report Download - page 135
Download and view the complete annual report
Please find page 135 of the 2013 Holiday Inn annual report below. You can navigate through the pages in the report by either clicking on the pages listed below, or by using the keyword search tool below to find specific information within the annual report.-
 1
1 -
2
-
3
-
4
-
5
-
6
-
7
-
8
-
9
-
10
-
11
-
12
-
13
-
14
-
15
-
16
-
17
-
18
-
19
-
20
-
21
-
22
-
23
-
24
-
25
-
26
-
27
-
28
-
29
-
30
-
31
-
32
-
33
-
34
-
35
-
36
-
37
-
38
-
39
-
40
-
41
-
42
-
43
-
44
-
45
-
46
-
47
-
48
-
49
-
50
-
51
-
52
-
53
-
54
-
55
-
56
-
57
-
58
-
59
-
60
-
61
-
62
-
63
-
64
-
65
-
66
-
67
-
68
-
69
-
70
-
71
-
72
-
73
-
74
-
75
-
76
-
77
-
78
-
79
-
80
-
81
-
82
-
83
-
84
-
85
-
86
-
87
-
88
-
89
-
90
-
91
-
92
-
93
-
94
-
95
-
96
-
97
-
98
-
99
-
100
-
101
-
102
-
103
-
104
-
105
-
106
-
107
-
108
-
109
-
110
-
111
-
112
-
113
-
114
-
115
-
116
-
117
-
118
-
119
-
120
-
121
-
122
-
123
-
124
-
 125
125 -
 126
126 -
 127
127 -
 128
128 -
 129
129 -
 130
130 -
 131
131 -
 132
132 -
 133
133 -
 134
134 -
 135
135 -
 136
136 -
 137
137 -
 138
138 -
 139
139 -
 140
140 -
 141
141 -
 142
142 -
 143
143 -
 144
144 -
 145
145 -
146
-
147
-
148
-
149
-
150
-
151
-
152
-
153
-
154
-
155
-
156
-
157
-
158
-
159
-
160
-
161
-
162
-
163
-
164
-
165
-
166
-
167
-
168
-
169
-
170
-
171
-
172
-
173
-
174
-
175
-
176
-
177
-
178
-
179
-
180
-
181
-
182
-
183
-
184
-
185
-
186
-
187
-
188
-
189
-
190
-
191
-
192
 |
 |

2013
$m
2012
$m
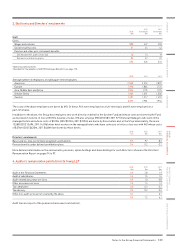
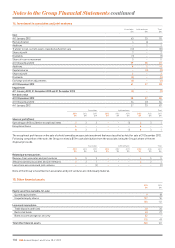
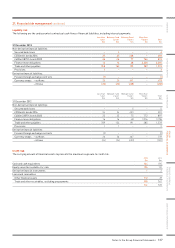
Analysed as:
Current 12 6
Non-current 236 155
248 161
Equity securities available-for-sale are measured at fair value (see note 24) and loans and receivables are held at amortised cost.
Equity securities available-for-sale were denominated in the following currencies: US dollars $84m (2012 $59m), Hong Kong dollars
$27m (2012 $24m) and other currencies $25m (2012 $29m). Unlisted equity shares are mainly investments in entities that own hotels
which the Group manages. Dividendincome from available for-sale equity securities of $6m (2012 $5m) is reported as other operating
income and expenses in the Group income statement.
Trade deposits and loans include a deposit of $37m made in 2011 to a hotel owner in connection with the renegotiation of a management
contract. The deposit is non-interest-bearing and repayable at the end of the management contract, and is therefore held at its discounted
value of $12m (2012 $11m); the discount unwinds to the income statement within financial income over the period to repayment.
Restricted funds include cash held in bank accounts which is pledged as collateral to insurance companies for risks retained by the Group,
cash held in the IHG Funding Trust (see note 26) and other amounts held in escrow.
The bank accounts pledged as security (£31m) are subject to a charge in favour of the members of the UK unfunded pension arrangement
(see note 26).
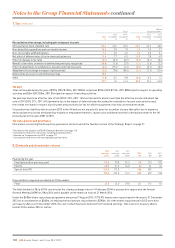
The movement in the provision for impairment of other financial assets during the year is as follows:
2013
$m
2012
$m
At 1 January (26) (25)
Reclassification –(1)
Amounts written off 1–
At 31 December (25) (26)
The provision is used to record impairment losses unless the Group is satisfied that no recovery of the amount is possible; at that point the
amount considered irrecoverable is either written off directly to the income statement or, if previously provided, against the financial asset
with no impact on the income statement.
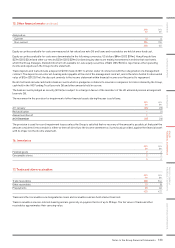
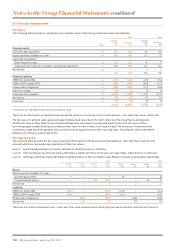
16. Inventories
2013
$m
2012
$m
Finished goods 22
Consumable stores 22
44
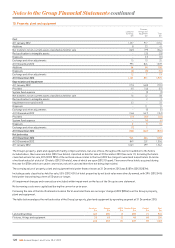
17. Trade and other receivables
2013
$m
2012
$m
Trade receivables 338 344
Other receivables 20 18
Prepayments 65 60
423 422
Trade and other receivables are designated as loans and receivables and are held at amortised cost.
Trade receivables are non-interest-bearing and are generally on payment terms of up to 30 days. The fair value of trade and other
receivables approximates their carrying value.
15. Other financial assets continued
Notes to the Group Financial Statements 133
OVERVIEW STRATEGIC REPORT GOVERNANCE
GROUP
FINANCIAL STATEMENTS
PARENT COMPANY
FINANCIAL STATEMENTS ADDITIONAL INFORMATION