Holiday Inn 2013 Annual Report Download - page 47
Download and view the complete annual report
Please find page 47 of the 2013 Holiday Inn annual report below. You can navigate through the pages in the report by either clicking on the pages listed below, or by using the keyword search tool below to find specific information within the annual report.-
 1
1 -
2
-
3
-
4
-
5
-
6
-
7
-
8
-
9
-
10
-
11
-
12
-
13
-
14
-
15
-
16
-
17
-
18
-
19
-
20
-
21
-
22
-
23
-
24
-
25
-
26
-
27
-
28
-
29
-
30
-
31
-
32
-
33
-
34
-
35
-
36
-
 37
37 -
 38
38 -
 39
39 -
 40
40 -
 41
41 -
 42
42 -
 43
43 -
 44
44 -
 45
45 -
 46
46 -
 47
47 -
 48
48 -
 49
49 -
 50
50 -
 51
51 -
 52
52 -
 53
53 -
 54
54 -
 55
55 -
 56
56 -
 57
57 -
58
-
59
-
60
-
61
-
62
-
63
-
64
-
65
-
66
-
67
-
68
-
69
-
70
-
71
-
72
-
73
-
74
-
75
-
76
-
77
-
78
-
79
-
80
-
81
-
82
-
83
-
84
-
85
-
86
-
87
-
88
-
89
-
90
-
91
-
92
-
93
-
94
-
95
-
96
-
97
-
98
-
99
-
100
-
101
-
102
-
103
-
104
-
105
-
106
-
107
-
108
-
109
-
110
-
111
-
112
-
113
-
114
-
115
-
116
-
117
-
118
-
119
-
120
-
121
-
122
-
123
-
124
-
125
-
126
-
127
-
128
-
129
-
130
-
131
-
132
-
133
-
134
-
135
-
136
-
137
-
138
-
139
-
140
-
141
-
142
-
143
-
144
-
145
-
146
-
147
-
148
-
149
-
150
-
151
-
152
-
153
-
154
-
155
-
156
-
157
-
158
-
159
-
160
-
161
-
162
-
163
-
164
-
165
-
166
-
167
-
168
-
169
-
170
-
171
-
172
-
173
-
174
-
175
-
176
-
177
-
178
-
179
-
180
-
181
-
182
-
183
-
184
-
185
-
186
-
187
-
188
-
189
-
190
-
191
-
192
 |
 |

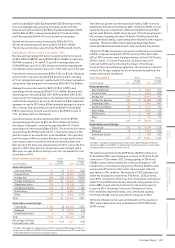
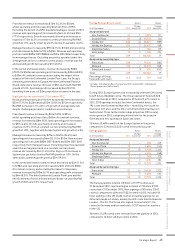
Europe hotel and room count Hotels Rooms
At 31 December 2013
Change
over 2012 2013
Change
over 2012
Analysed by brand
InterContinental 31 19,525 131
Crowne Plaza 83 (1) 19,522 (44)
Holiday Inn1282 (6) 45,621 (989)
Holiday Inn Express 215 325,371 468
Staybridge Suites 51784 179
Hotel Indigo 13 31,243 294
Total 629 1102,066 39
Analysed by ownership type
Franchised 528 –79,517 (382)
Managed 100 222,079 868
Owned and leased 1(1) 470 (447)
Total 629 1102,066 39
Percentage of Group
hotel and room count 13.4 (0.2) 14.9 (0.2)
1
Includes 2 Holiday Inn Resort properties (212 rooms) (2012: 3 Holiday Inn
Resort properties (362 rooms)).
During 2013, Europe System size increased by one hotel (39 rooms)
to 629 hotels (102,066 rooms). The Group opened 21 hotels (3,528
rooms) in Europe in 2013, compared to 39 hotels (5,477 rooms) in
2012. 2013 openings included two InterContinental hotels, the
194-room InterContinental Marseille – Hotel Dieu, the fourth for
the brand in France, and the 216-room InterContinental Davos in
Switzerland. Three further Hotel Indigo properties (293 rooms)
were opened in 2013, comprising a third hotel for the brand in
Germany and first openings in Spain and Israel.
20 hotels (3,489 rooms) left the Europe System in the period,
compared to 23 hotels (3,335 rooms) in the previous year.
Europe pipeline Hotels Rooms
At 31 December 2013
Change
over 2012 2013
Change
over 2012
Analysed by brand
InterContinental 2–653 249
Crowne Plaza 12 –2,624 (145)
Holiday Inn 35 15 6,612 2,345
Holiday Inn Express 43 –6,016 (268)
Staybridge Suites 32298 130
Hotel Indigo 15 21,576 284
Total 110 19 17,779 2,595
Analysed by ownership type
Franchised 97 14 14,119 1,933
Managed 13 53,660 662
Total 110 19 17,779 2,595
The Europe pipeline totalled 110 hotels (17,779 rooms) as at
31 December 2013, representing an increase of 19 hotels (2,595
rooms) over 31 December 2012. New signings of 50 hotels (7,542
rooms), compared to 48 hotels (7,023 rooms) in 2012, included 18
hotel signings in the UK (2,436 rooms), including signings for six
different brands in London, notably the 453-room InterContinental
London – The O2. The Group also signed six new hotels (1,116
rooms) in Germany and ten new hotels (1,737 rooms) in countries
in the CIS.
10 hotels (1,419 rooms) were removed from the pipeline in 2013,
compared to 16 hotels (3,044 rooms) in 2012.
Franchised revenue increased by $13m (14.3%) to $104m,
whilst operating profit increased by $14m (21.5%) to $79m.
Excluding the benefit of a $9m liquidated damages receipt in 2013,
revenue andoperating profit increased by $4m (4.4%) and $5m
(7.7%) respectively. Growth was mainly driven by an increase in
royalties of 7.0% (6.3% at constant currency) reflecting RevPAR
growth of 1.5%, partly offset by a 0.2% decline in available rooms.
Managed revenue increased by $9m (6.1%) to $156m and operating
profit decreased by $2m (6.3%) to $30m. Revenue and operating
profit included $89m (2012 $80m) and $2m (2012 $2m) respectively
from managed leases. Excluding properties operated under this
arrangement and on a constant currency basis, revenue was flat
and operating profit decreased by $1m (3.3%).
In the owned and leased estate, revenue decreased by $58m
(29.3%) to $140m and operating profit decreased by $20m (40.0%)
to $30m. At constant currency and excluding the impact of the
disposal of the InterContinental London Park Lane, the Group’s
remaining owned hotel in Europe, the InterContinental Paris Le
Grand, delivered a revenue increase of $5m (4.6%) with RevPAR
growth of 5.3%. Operating profit increased by $4m (23.5%),
benefiting from a one-off $3m property tax recovery in the year.
Highlights for the year ended 31 December 2012
Revenue and operating profit before exceptional items increased by
$31m (7.7%) to $436m and by $12m (12.0%) to $112m respectively.
RevPAR increased 1.7%, with 1.2% growth in average daily rate
despite challenging economic conditions across Europe.
Franchised revenue increased by $5m (5.8%) to $91m,
whilst operating profit was flat at $65m. At constant currency,
revenue increased by $8m (9.3%) and operating profit increased
by $3m (4.6%). Growth was mainly driven by an increase in
royalties of 2.7% (7.5% at constant currency) reflecting RevPAR
growth of 1.8%, together with Europe System size growth of 4.0%.
Managed revenue increased by $29m to $147m (24.6%) and
operating profit increased by $6m (23.1%) to $32m. Revenue and
operating profit included $80m (2011 $46m) and $2m (2011 $nil)
respectively from managed leases. Excluding properties operated
under this arrangement and on a constant currency basis,
revenuedecreased by $1m (1.4%) reflecting a 4.3% decrease in
System size partially offset by RevPAR growth of 1.0%. On the
samebasis, operating profit grew by $5m (19.2%).
In the owned and leased estate, revenue decreased by $3m (1.5%)
to$198m and operating profit increased by $1m (2.0%) to $50m.
Atconstant currency and excluding the impact of disposals,
revenueincreased by $10m (5.1%) and operating profit increased
by$4m (8.3%). The InterContinental London Park Lane and the
InterContinental Paris Le Grand delivered year-on-year RevPAR
growth of 8.0% and 2.5% respectively.
Strategic Report 45
OVERVIEW STRATEGIC REPORT GOVERNANCE
GROUP
FINANCIAL STATEMENTS
PARENT COMPANY
FINANCIAL STATEMENTS ADDITIONAL INFORMATION