Holiday Inn 2013 Annual Report Download - page 15
Download and view the complete annual report
Please find page 15 of the 2013 Holiday Inn annual report below. You can navigate through the pages in the report by either clicking on the pages listed below, or by using the keyword search tool below to find specific information within the annual report.-
 1
1 -
2
-
3
-
4
-
 5
5 -
 6
6 -
 7
7 -
 8
8 -
 9
9 -
 10
10 -
 11
11 -
 12
12 -
 13
13 -
 14
14 -
 15
15 -
 16
16 -
 17
17 -
 18
18 -
 19
19 -
 20
20 -
 21
21 -
 22
22 -
 23
23 -
 24
24 -
 25
25 -
26
-
27
-
28
-
29
-
30
-
31
-
32
-
33
-
34
-
35
-
36
-
37
-
38
-
39
-
40
-
41
-
42
-
43
-
44
-
45
-
46
-
47
-
48
-
49
-
50
-
51
-
52
-
53
-
54
-
55
-
56
-
57
-
58
-
59
-
60
-
61
-
62
-
63
-
64
-
65
-
66
-
67
-
68
-
69
-
70
-
71
-
72
-
73
-
74
-
75
-
76
-
77
-
78
-
79
-
80
-
81
-
82
-
83
-
84
-
85
-
86
-
87
-
88
-
89
-
90
-
91
-
92
-
93
-
94
-
95
-
96
-
97
-
98
-
99
-
100
-
101
-
102
-
103
-
104
-
105
-
106
-
107
-
108
-
109
-
110
-
111
-
112
-
113
-
114
-
115
-
116
-
117
-
118
-
119
-
120
-
121
-
122
-
123
-
124
-
125
-
126
-
127
-
128
-
129
-
130
-
131
-
132
-
133
-
134
-
135
-
136
-
137
-
138
-
139
-
140
-
141
-
142
-
143
-
144
-
145
-
146
-
147
-
148
-
149
-
150
-
151
-
152
-
153
-
154
-
155
-
156
-
157
-
158
-
159
-
160
-
161
-
162
-
163
-
164
-
165
-
166
-
167
-
168
-
169
-
170
-
171
-
172
-
173
-
174
-
175
-
176
-
177
-
178
-
179
-
180
-
181
-
182
-
183
-
184
-
185
-
186
-
187
-
188
-
189
-
190
-
191
-
192
 |
 |

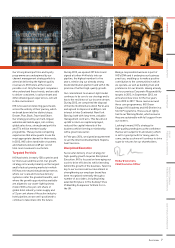
Asia, Middle East and Africa (AMEA)
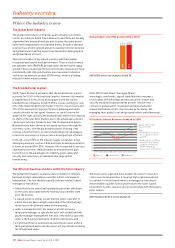
Industry
AMEA is a diverse geographical region
comprising many individual country
markets. Overall RevPAR increased 6.1%,
led by a 5% growth in average daily rate.
The number of rooms available across
the industry increased by 2.6%.
Strong growth was seen in Southeast
Asia,where RevPAR grew 7.9% driven
bycontinued strength in Indonesia and
Thailand; Japan, where RevPAR grew
by11.4%; and in the Middle East, where
RevPAR growth of 5.5% was achieved
despite continuing geopolitical unrest.
In India, 2013 was a challenging year with
pricing challenges as a result of rooms
supply growth of 4.6% leading to a
RevPARdecline of 3.3%.
In Australasia, RevPAR was up 3.9% driven
by average daily rate up 2.7%, reflecting
strong economic conditions in Australia.
IHG’s AMEA region
IHG is represented widely across the region,
both geographically and by brand, and
comparisons across the industry are hard
to make. In addition, almost all of our net
room growth is located in developing
markets, where initial RevPAR expectations
are on average about 30% of the level
achieved by a mature hotel in that region.
Even after three to five years, hotels in these
markets are expected to achieve around
70% of the absolute RevPAR of primary
city hotels. Comparable RevPAR increased
6.1% in the year but, reflecting new hotels
in the developing markets, total RevPAR
growth was 2.8%. Overall strong trading
in Southeast Asia and Japan led the
performance with RevPAR up 9.9% and
9.6% respectively. In Australasia, RevPAR
increased by 4.5%. In the Middle East,
RevPAR was up 3.2%, driven by good
performance in Saudi Arabia and the UAE,
offset by geopolitical unrest impacting our
business in Egypt and Lebanon.
Greater China
Industry
Hotel industry RevPAR in Greater China
as lower than industry expectations
ithfull-year RevPAR declining by 4.2%.
The RevPAR decline was predominantly
ledby a reduced average daily rate
(anannual reduction of 3.1%), combined
witha reduction in occupancy levels.
Overall demand for rooms increased
overthe year, but occupancy rates were
impacted by supply growth of 4.6%.
The industry was impacted by a number of
factors in 2013 including natural disasters,
slower macroeconomic conditions as
reflected in GDP growth of only 7.7%
(thesoftest pace of expansion since
1999)and the impact of the China-Japan
territorial island dispute. Despite the
challenges, travel and tourism continue
tobe a strategic pillar of the Chinese
government’s five-year plan and the
continuing growth of the middle-classes
and a shift in emphasis to a consumption
led economy are all positive factors for
the medium to long-term prospects.
IHG’s Greater China region
IHG’s comparable RevPAR increased 1%
asthe scale and strength of our business
drove a significant outperformance
compared to the industry throughout 2013.
IHG has brands across multiple price
points and hotels in 70 cities which
positions us well across the region.
Conditions were difficult, but we opened
7,669 rooms and added 15,000 rooms to our
pipeline, including seven HUALUXE hotels
taking our pipeline of this key new brand
to21 hotels. From a growth perspective,
almost 70% of the hotels in the pipeline are
under construction. As with AMEA, much
of the room growth is located in developing
tier 2 and tier 3 cities with lower initial
RevPAR expectation when compared to
primary city hotels.
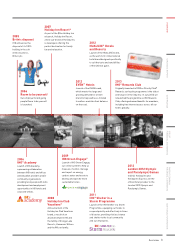
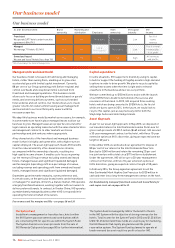
IHG System
We continued to grow the IHG System size
in 2013 (hotels franchised, managed,
owned or leased under IHG’s brands –
see Our business model on page 16).
As at 31 December 2013, we had 686,873
open IHG hotel rooms (4,697 hotels)
in nearly 100 countries and territories
around the world.
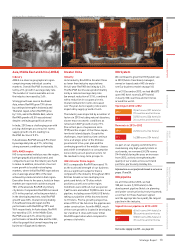
Openings in 2013 v 2012
Removals in 2013 v 2012
As part of our ongoing commitment to
maintaining only high-quality hotels in
our brands, we removed 24,576 rooms
(144 hotels) during the year, an increase
from 2012, actively strengthening the
quality of our estate across our brand
portfolio, particularly Holiday Inn.
Information on our preferred brands is set out on
pages 17 and 20.
IHG pipeline
As at 31 December 2013, we had
180,461 rooms (1,120 hotels) in the
development pipeline (hotels in planning
and under construction but not yet opened;
a contract for these has been signed
and the appropriate fees paid); the largest
pipeline in the industry.
Signed into our pipeline in 2013 v 2012
Net rooms supply is a KPI – see page 38.
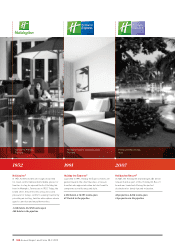
2012
2013
33,922 rooms (226 hotels) in
26 countries and territories
35,467 rooms (237 hotels) in
33 countries and territories
2012
2013
16,288 rooms (104 hotels)
24,576 rooms (144 hotels)
2012
2013
53,812 rooms (356 hotels) in
33 countries and territories
65,461 rooms (444 hotels) in
38 countries and territories
Holiday Inn Resort Kandooma, Maldives
Crowne Plaza Resort, Xishuangbanna, People’s Republic of China
Strategic Report 13
OVERVIEW STRATEGIC REPORT GOVERNANCE
GROUP
FINANCIAL STATEMENTS
PARENT COMPANY
FINANCIAL STATEMENTS ADDITIONAL INFORMATION