HSBC 2010 Annual Report Download - page 97
Download and view the complete annual report
Please find page 97 of the 2010 HSBC annual report below. You can navigate through the pages in the report by either clicking on the pages listed below, or by using the keyword search tool below to find specific information within the annual report.-
 1
1 -
2
-
3
-
4
-
5
-
6
-
7
-
8
-
9
-
10
-
11
-
12
-
13
-
14
-
15
-
16
-
17
-
18
-
19
-
20
-
21
-
22
-
23
-
24
-
25
-
26
-
27
-
28
-
29
-
30
-
31
-
32
-
33
-
34
-
35
-
36
-
37
-
38
-
39
-
40
-
41
-
42
-
43
-
44
-
45
-
46
-
47
-
48
-
49
-
50
-
51
-
52
-
53
-
54
-
55
-
56
-
57
-
58
-
59
-
60
-
61
-
62
-
63
-
64
-
65
-
66
-
67
-
68
-
69
-
70
-
71
-
72
-
73
-
74
-
75
-
76
-
77
-
78
-
79
-
80
-
81
-
82
-
83
-
84
-
85
-
86
-
 87
87 -
 88
88 -
 89
89 -
 90
90 -
 91
91 -
 92
92 -
 93
93 -
 94
94 -
 95
95 -
 96
96 -
 97
97 -
 98
98 -
 99
99 -
 100
100 -
 101
101 -
 102
102 -
 103
103 -
 104
104 -
 105
105 -
 106
106 -
 107
107 -
108
-
109
-
110
-
111
-
112
-
113
-
114
-
115
-
116
-
117
-
118
-
119
-
120
-
121
-
122
-
123
-
124
-
125
-
126
-
127
-
128
-
129
-
130
-
131
-
132
-
133
-
134
-
135
-
136
-
137
-
138
-
139
-
140
-
141
-
142
-
143
-
144
-
145
-
146
-
147
-
148
-
149
-
150
-
151
-
152
-
153
-
154
-
155
-
156
-
157
-
158
-
159
-
160
-
161
-
162
-
163
-
164
-
165
-
166
-
167
-
168
-
169
-
170
-
171
-
172
-
173
-
174
-
175
-
176
-
177
-
178
-
179
-
180
-
181
-
182
-
183
-
184
-
185
-
186
-
187
-
188
-
189
-
190
-
191
-
192
-
193
-
194
-
195
-
196
-
197
-
198
-
199
-
200
-
201
-
202
-
203
-
204
-
205
-
206
-
207
-
208
-
209
-
210
-
211
-
212
-
213
-
214
-
215
-
216
-
217
-
218
-
219
-
220
-
221
-
222
-
223
-
224
-
225
-
226
-
227
-
228
-
229
-
230
-
231
-
232
-
233
-
234
-
235
-
236
-
237
-
238
-
239
-
240
-
241
-
242
-
243
-
244
-
245
-
246
-
247
-
248
-
249
-
250
-
251
-
252
-
253
-
254
-
255
-
256
-
257
-
258
-
259
-
260
-
261
-
262
-
263
-
264
-
265
-
266
-
267
-
268
-
269
-
270
-
271
-
272
-
273
-
274
-
275
-
276
-
277
-
278
-
279
-
280
-
281
-
282
-
283
-
284
-
285
-
286
-
287
-
288
-
289
-
290
-
291
-
292
-
293
-
294
-
295
-
296
-
297
-
298
-
299
-
300
-
301
-
302
-
303
-
304
-
305
-
306
-
307
-
308
-
309
-
310
-
311
-
312
-
313
-
314
-
315
-
316
-
317
-
318
-
319
-
320
-
321
-
322
-
323
-
324
-
325
-
326
-
327
-
328
-
329
-
330
-
331
-
332
-
333
-
334
-
335
-
336
-
337
-
338
-
339
-
340
-
341
-
342
-
343
-
344
-
345
-
346
-
347
-
348
-
349
-
350
-
351
-
352
-
353
-
354
-
355
-
356
-
357
-
358
-
359
-
360
-
361
-
362
-
363
-
364
-
365
-
366
-
367
-
368
-
369
-
370
-
371
-
372
-
373
-
374
-
375
-
376
-
377
-
378
-
379
-
380
-
381
-
382
-
383
-
384
-
385
-
386
-
387
-
388
-
389
-
390
-
391
-
392
-
393
-
394
-
395
-
396
 |
 |

95
Overview Operating & Financial Review Governance Financial Statements Shareholder Information
periods stated above. Collections procedures may
continue after write-off.
Cross-border exposures
We assess the vulnerability of countries to foreign
currency payment restrictions, including economic
and political factors, when considering impairment
allowances on cross-border exposures. Impairment
allowances are assessed in respect of all qualifying
exposures within vulnerable countries unless these
exposures and the inherent risks are:
• performing, trade-related and of less than one
year’s maturity;
• mitigated by acceptable security cover which is,
other than in exceptional cases, held outside the
country concerned;
• in the form of securities held for trading
purposes for which a liquid and active market
exists, and which are measured at fair value
daily; and
• performing facilities with a principal (excluding
security) of US$1m or below and/or with
maturity dates shorter than three months.
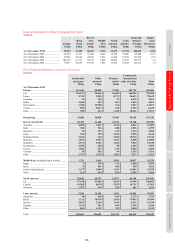
Credit exposure
Maximum exposure to credit risk
(Audited)
Our credit exposure is spread across a broad range of
asset classes, including derivatives, trading assets,
loans and advances to customers, loans and advances
to banks and financial investments. In 2010,
exposure to credit risk remained diversified across
classes. However, the balance changed compared
with the end of 2009, reflecting growth in loans
and advances to both customers and banks, and a
reduction in trading assets due to the deconsolidation
of the Constant Net Asset Value funds.
Residential mortgage lending continued to
represent a significant portion of our overall credit
exposure. In 2010, the credit quality of our mortgage
portfolios generally improved, reflecting economic
conditions and a stabilisation of unemployment and
house prices in most of our key markets. Despite
some improvement, economic and housing market
conditions remain difficult across the US and we
remain focused on running off the residual balances
in our Consumer Lending and Mortgage Services
portfolio. In the UK, we grew our residential
mortgage lending exposure as a result of successful
promotional campaigns and competitive pricing. The
consistent application of conservative underwriting
criteria ensured the credit quality of our residential
mortgage exposure in the UK remained satisfactory
and well secured. Our exposure to the Hong Kong
residential mortgage market also grew during 2010;
we continued to lend conservatively with an average
loan-to-value ratio of 55% on new mortgage sales.
For further commentary on personal lending, see
‘Areas of special interest – Personal Lending’ on
page 106.
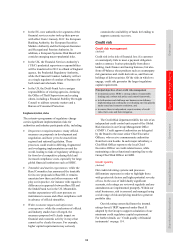
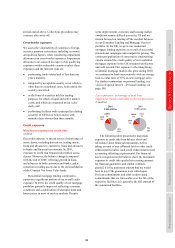
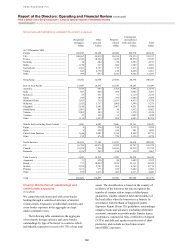
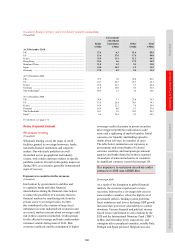
Loss experience: percentage of total loan
impairment charges and other credit risk provisions
(Unaudited)
2010
US$14,039m
2009
US$26,488m
PFS
75%
CMB
12%
GB&M
12%
Other
1%
PFS
80%
CMB
13%
GB&M
7%
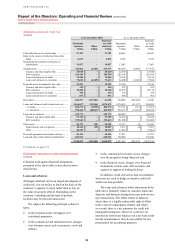
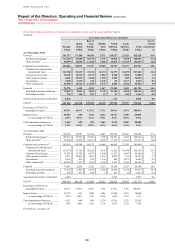
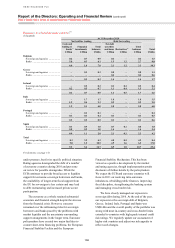
The following table presents the maximum
exposure to credit risk from balance sheet and
off-balance sheet financial instruments, before
taking account of any collateral held or other credit
enhancements (unless such credit enhancements meet
accounting offsetting requirements). For financial
assets recognised on the balance sheet, the maximum
exposure to credit risk equals their carrying amount;
for financial guarantees and similar contracts
granted, it is the maximum amount that we would
have to pay if the guarantees were called upon.
For loan commitments and other credit-related
commitments that are irrevocable over the life of the
respective facilities, it is generally the full amount of
the committed facilities.