HSBC 2010 Annual Report Download - page 108
Download and view the complete annual report
Please find page 108 of the 2010 HSBC annual report below. You can navigate through the pages in the report by either clicking on the pages listed below, or by using the keyword search tool below to find specific information within the annual report.-
 1
1 -
2
-
3
-
4
-
5
-
6
-
7
-
8
-
9
-
10
-
11
-
12
-
13
-
14
-
15
-
16
-
17
-
18
-
19
-
20
-
21
-
22
-
23
-
24
-
25
-
26
-
27
-
28
-
29
-
30
-
31
-
32
-
33
-
34
-
35
-
36
-
37
-
38
-
39
-
40
-
41
-
42
-
43
-
44
-
45
-
46
-
47
-
48
-
49
-
50
-
51
-
52
-
53
-
54
-
55
-
56
-
57
-
58
-
59
-
60
-
61
-
62
-
63
-
64
-
65
-
66
-
67
-
68
-
69
-
70
-
71
-
72
-
73
-
74
-
75
-
76
-
77
-
78
-
79
-
80
-
81
-
82
-
83
-
84
-
85
-
86
-
87
-
88
-
89
-
90
-
91
-
92
-
93
-
94
-
95
-
96
-
97
-
 98
98 -
 99
99 -
 100
100 -
 101
101 -
 102
102 -
 103
103 -
 104
104 -
 105
105 -
 106
106 -
 107
107 -
 108
108 -
 109
109 -
 110
110 -
 111
111 -
 112
112 -
 113
113 -
 114
114 -
 115
115 -
 116
116 -
 117
117 -
 118
118 -
119
-
120
-
121
-
122
-
123
-
124
-
125
-
126
-
127
-
128
-
129
-
130
-
131
-
132
-
133
-
134
-
135
-
136
-
137
-
138
-
139
-
140
-
141
-
142
-
143
-
144
-
145
-
146
-
147
-
148
-
149
-
150
-
151
-
152
-
153
-
154
-
155
-
156
-
157
-
158
-
159
-
160
-
161
-
162
-
163
-
164
-
165
-
166
-
167
-
168
-
169
-
170
-
171
-
172
-
173
-
174
-
175
-
176
-
177
-
178
-
179
-
180
-
181
-
182
-
183
-
184
-
185
-
186
-
187
-
188
-
189
-
190
-
191
-
192
-
193
-
194
-
195
-
196
-
197
-
198
-
199
-
200
-
201
-
202
-
203
-
204
-
205
-
206
-
207
-
208
-
209
-
210
-
211
-
212
-
213
-
214
-
215
-
216
-
217
-
218
-
219
-
220
-
221
-
222
-
223
-
224
-
225
-
226
-
227
-
228
-
229
-
230
-
231
-
232
-
233
-
234
-
235
-
236
-
237
-
238
-
239
-
240
-
241
-
242
-
243
-
244
-
245
-
246
-
247
-
248
-
249
-
250
-
251
-
252
-
253
-
254
-
255
-
256
-
257
-
258
-
259
-
260
-
261
-
262
-
263
-
264
-
265
-
266
-
267
-
268
-
269
-
270
-
271
-
272
-
273
-
274
-
275
-
276
-
277
-
278
-
279
-
280
-
281
-
282
-
283
-
284
-
285
-
286
-
287
-
288
-
289
-
290
-
291
-
292
-
293
-
294
-
295
-
296
-
297
-
298
-
299
-
300
-
301
-
302
-
303
-
304
-
305
-
306
-
307
-
308
-
309
-
310
-
311
-
312
-
313
-
314
-
315
-
316
-
317
-
318
-
319
-
320
-
321
-
322
-
323
-
324
-
325
-
326
-
327
-
328
-
329
-
330
-
331
-
332
-
333
-
334
-
335
-
336
-
337
-
338
-
339
-
340
-
341
-
342
-
343
-
344
-
345
-
346
-
347
-
348
-
349
-
350
-
351
-
352
-
353
-
354
-
355
-
356
-
357
-
358
-
359
-
360
-
361
-
362
-
363
-
364
-
365
-
366
-
367
-
368
-
369
-
370
-
371
-
372
-
373
-
374
-
375
-
376
-
377
-
378
-
379
-
380
-
381
-
382
-
383
-
384
-
385
-
386
-
387
-
388
-
389
-
390
-
391
-
392
-
393
-
394
-
395
-
396
 |
 |

HSBC HOLDINGS PLC
Report of the Directors: Operating and Financial Review (continued)
Risk > Credit risk > Areas of special interest > Personal lending
106
Across our portfolios, credit risk is mitigated by
long-standing and conservative policies on asset
origination which focus on relationships with long-
term customers and limited initial leverage. We also
set and monitor sector risk appetite limits at Group
and regional levels to detect and prevent higher risk
concentrations. While individual regions differ in
their approach, typically origination loan to value
ratios would be less than 65% across the Group.
Personal lending
(Unaudited)
We provide a broad range of secured and unsecured
personal lending products to meet customer needs.
Given the diverse nature of the markets in which
we operate, the range is not standard across
all countries but is tailored to meet the demands
of individual markets while using appropriate
distribution channels and, wherever possible, global
IT platforms.
Personal lending includes advances to customers
for asset purchases, such as residential property and
motor vehicles, where the loans are typically secured
by the assets being acquired. We also offer loans
secured on existing assets, such as first and second
liens on residential property; unsecured lending
products such as overdrafts, credit cards and payroll
loans; and debt consolidation loans which may be
secured or unsecured.
In 2010, credit quality in our personal lending
portfolios improved, reflecting a recovery of
economic conditions in most markets. Delinquency
levels and loan impairment charges declined,
particularly in those countries which had previously
been most affected by rising unemployment and
house price depreciation.
The commentary that follows is on an
underlying basis.
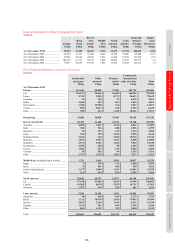
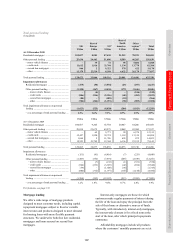
At 31 December 2010, total personal lending
was US$425bn, a decline of 2% from 31 December
2009 as the reduction in our US run-off portfolios
continued, partly offset by notable growth in Hong
Kong and the UK. Within our PFS business, total
loan impairment charges and other credit risk
provisions of US$11.3bn were 44% lower than in
2009, and were concentrated in North America
(US$8.2bn) and, to a lesser extent, Europe
(US$1.2bn) and Latin America (US$1.2bn).
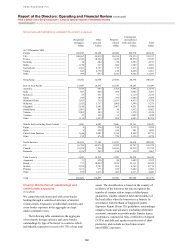
In the UK, total personal lending was
US$129bn, an increase of 4% compared with the end
of 2009. The increase was due to growth in mortgage
lending as a result of the enhancement of our product
offerings, successful marketing and competitive
pricing (UK mortgage lending is discussed in greater
detail on page 108). This was partly offset by an 8%
fall in other personal lending balances, reflecting a
reduction in unsecured lending products as we
tightened our underwriting criteria and some
consumers reduced their indebtedness.
Total personal lending balances in the US at
31 December 2010 were US$109bn, a decrease of
19% compared with the end of 2009, reflecting the
continued reduction in balances in our consumer
finance run-off portfolios and lower balances in our
Card and Retail Services business.
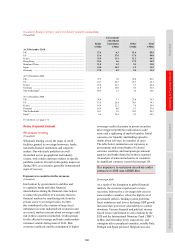
US residential mortgage lending balances fell by
12% to US$58bn, driven by the decisions taken in
2007 to close the Mortgage Services business and in
March 2009 to close all Consumer Lending branches
and run off the residual consumer finance balances.
US mortgage lending is discussed in greater detail on
page 108.
In PFS, total loan impairment charges and
other credit risk provisions were 44% down
on 2009.
Other personal lending balances in the US were
US$52bn at 31 December 2010, 25% lower than at
the end of 2009. Credit card balances declined by
14% reflecting a reduction in active customer
accounts and an increased focus by our customers
on reducing outstanding credit card debt.
In March we sold US$1.0bn of vehicle finance
loans. This was followed in August by the sale of the
residual vehicle finance loans (US$4.3bn) to the
same purchaser.
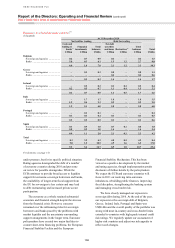
In Hong Kong, total personal lending grew by
20% to US$57bn as a result of strong growth in
residential mortgage lending. In the Rest of Asia-
Pacific region, personal lending also grew strongly
across many countries, notably Australia, Singapore
and Malaysia, through successful marketing. This
growth was partly offset by a managed reduction in
unsecured personal lending balances in India.
In Latin America, total personal lending was
broadly flat at US$22bn as moderate growth in
residential mortgage lending, particularly in Brazil,
was more than offset by a decline in other personal
lending. The latter reflected falls in credit card
lending in Mexico and other higher-risk portfolios in
Mexico and Brazil as we continued to reduce higher-
risk portfolios in the region and tighten our
underwriting criteria.
For an analysis of loan impairment allowances
and impaired loans, see page 119.