HSBC 2010 Annual Report Download - page 148
Download and view the complete annual report
Please find page 148 of the 2010 HSBC annual report below. You can navigate through the pages in the report by either clicking on the pages listed below, or by using the keyword search tool below to find specific information within the annual report.-
 1
1 -
2
-
3
-
4
-
5
-
6
-
7
-
8
-
9
-
10
-
11
-
12
-
13
-
14
-
15
-
16
-
17
-
18
-
19
-
20
-
21
-
22
-
23
-
24
-
25
-
26
-
27
-
28
-
29
-
30
-
31
-
32
-
33
-
34
-
35
-
36
-
37
-
38
-
39
-
40
-
41
-
42
-
43
-
44
-
45
-
46
-
47
-
48
-
49
-
50
-
51
-
52
-
53
-
54
-
55
-
56
-
57
-
58
-
59
-
60
-
61
-
62
-
63
-
64
-
65
-
66
-
67
-
68
-
69
-
70
-
71
-
72
-
73
-
74
-
75
-
76
-
77
-
78
-
79
-
80
-
81
-
82
-
83
-
84
-
85
-
86
-
87
-
88
-
89
-
90
-
91
-
92
-
93
-
94
-
95
-
96
-
97
-
98
-
99
-
100
-
101
-
102
-
103
-
104
-
105
-
106
-
107
-
108
-
109
-
110
-
111
-
112
-
113
-
114
-
115
-
116
-
117
-
118
-
119
-
120
-
121
-
122
-
123
-
124
-
125
-
126
-
127
-
128
-
129
-
130
-
131
-
132
-
133
-
134
-
135
-
136
-
137
-
 138
138 -
 139
139 -
 140
140 -
 141
141 -
 142
142 -
 143
143 -
 144
144 -
 145
145 -
 146
146 -
 147
147 -
 148
148 -
 149
149 -
 150
150 -
 151
151 -
 152
152 -
 153
153 -
 154
154 -
 155
155 -
 156
156 -
 157
157 -
 158
158 -
159
-
160
-
161
-
162
-
163
-
164
-
165
-
166
-
167
-
168
-
169
-
170
-
171
-
172
-
173
-
174
-
175
-
176
-
177
-
178
-
179
-
180
-
181
-
182
-
183
-
184
-
185
-
186
-
187
-
188
-
189
-
190
-
191
-
192
-
193
-
194
-
195
-
196
-
197
-
198
-
199
-
200
-
201
-
202
-
203
-
204
-
205
-
206
-
207
-
208
-
209
-
210
-
211
-
212
-
213
-
214
-
215
-
216
-
217
-
218
-
219
-
220
-
221
-
222
-
223
-
224
-
225
-
226
-
227
-
228
-
229
-
230
-
231
-
232
-
233
-
234
-
235
-
236
-
237
-
238
-
239
-
240
-
241
-
242
-
243
-
244
-
245
-
246
-
247
-
248
-
249
-
250
-
251
-
252
-
253
-
254
-
255
-
256
-
257
-
258
-
259
-
260
-
261
-
262
-
263
-
264
-
265
-
266
-
267
-
268
-
269
-
270
-
271
-
272
-
273
-
274
-
275
-
276
-
277
-
278
-
279
-
280
-
281
-
282
-
283
-
284
-
285
-
286
-
287
-
288
-
289
-
290
-
291
-
292
-
293
-
294
-
295
-
296
-
297
-
298
-
299
-
300
-
301
-
302
-
303
-
304
-
305
-
306
-
307
-
308
-
309
-
310
-
311
-
312
-
313
-
314
-
315
-
316
-
317
-
318
-
319
-
320
-
321
-
322
-
323
-
324
-
325
-
326
-
327
-
328
-
329
-
330
-
331
-
332
-
333
-
334
-
335
-
336
-
337
-
338
-
339
-
340
-
341
-
342
-
343
-
344
-
345
-
346
-
347
-
348
-
349
-
350
-
351
-
352
-
353
-
354
-
355
-
356
-
357
-
358
-
359
-
360
-
361
-
362
-
363
-
364
-
365
-
366
-
367
-
368
-
369
-
370
-
371
-
372
-
373
-
374
-
375
-
376
-
377
-
378
-
379
-
380
-
381
-
382
-
383
-
384
-
385
-
386
-
387
-
388
-
389
-
390
-
391
-
392
-
393
-
394
-
395
-
396
 |
 |

HSBC HOLDINGS PLC
Report of the Directors: Operating and Financial Review (continued)
Risk > Market risk > Sensitivity analysis / Trading and non-trading portfolios
146
We routinely validate the accuracy of our VAR
models by back-testing the actual daily profit and
loss results, adjusted to remove non-modelled
items such as fees and commissions, against the
corresponding VAR numbers. Statistically, we would
expect to see losses in excess of VAR only 1% of the
time over a one-year period. The actual number of
excesses over this period can therefore be used to
gauge how well the models are performing.
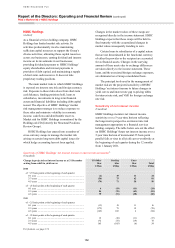
Stress testing
(Audited)
In recognition of VAR’s limitations, we augment it
with stress testing to evaluate the potential impact on
portfolio values of more extreme, although plausible,
events or movements in a set of financial variables.
The process is governed by the Stress Testing
Review Group forum which, in conjunction with
regional risk managers, determines the scenarios to
be applied at portfolio and consolidated levels, as
follows:
• sensitivity scenarios consider the impact of any
single risk factor or set of factors that are
unlikely to be captured within the VAR models,
such as the break of a currency peg;
• technical scenarios consider the largest move in
each risk factor, without consideration of any
underlying market correlation;
• hypothetical scenarios consider potential macro
economic events, for example, a global flu
pandemic; and
• historical scenarios incorporate historical
observations of market movements during
previous periods of stress which would not be
captured within VAR.
Stress testing results provide senior management
with an assessment of the financial effect such
events would have on our profit.
Trading and non-trading portfolios
(Audited)
The following table provides an overview of the
reporting of risks within this section:
Portfolio
Trading Non-trading
Risk type
Foreign exchange and
commodity ........................ VAR VAR63
Interest rate ........................... VAR VAR64
Equity .................................... VAR Sensitivity
Credit spread ......................... VAR VAR65
For footnotes, see page 174.
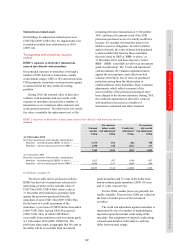
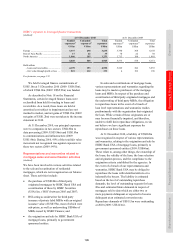
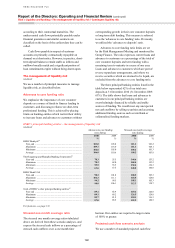
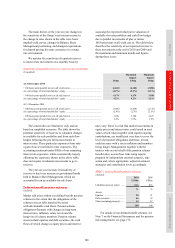
Value at risk of the trading and non-trading
portfolios
Our Group VAR, both trading and non-trading, was
as follows:
Value at risk (excluding credit spread VAR)
(Audited)
2010 2009
US$m US$m
At 31 December ................... 266.6 204.5
Average ................................ 199.8 156.1
Minimum ............................. 139.5 105.7
Maximum ............................. 285.7 204.5
The rise in interest rate volatility, coupled with a
modest increase in underlying interest rate exposure,
resulted in a higher VAR and higher maximum VAR
at the end of 2010 compared with the end of 2009.
The volatility in the other asset classes in 2010 was
lower than in 2009.
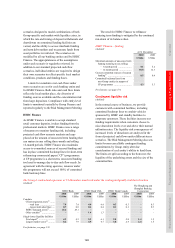
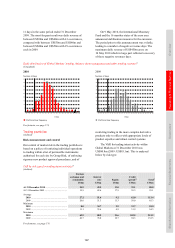
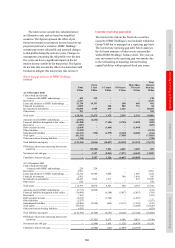
Our Group daily VAR, both trading and non-
trading, was as follows:
Daily VAR (excluding credit spread) (US$m)
(Unaudited)
0
50
100
150
200
250
300
Dec-08 Apr-09 Aug-09 Dec-09 Apr-10 Aug-10 Dec-10
The major contributor to our Group trading and
non-trading VAR was Global Markets.
The histogram below illustrates the frequency of
daily revenue arising from Global Markets’ trading,
balance sheet management and other trading
activities.
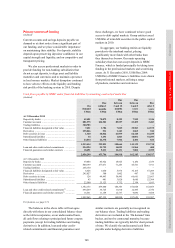
Daily revenue
(Unaudited)
2010 2009
US$m US$m
Average daily revenue ......... 49.3 59.9
Standard deviation66 ............. 37.8 38.4
For footnote, see page 174.
An analysis of the frequency distribution of
daily revenue shows that there were nine days with
negative revenues during 2010 compared with