HSBC 2010 Annual Report Download - page 284
Download and view the complete annual report
Please find page 284 of the 2010 HSBC annual report below. You can navigate through the pages in the report by either clicking on the pages listed below, or by using the keyword search tool below to find specific information within the annual report.-
 1
1 -
2
-
3
-
4
-
5
-
6
-
7
-
8
-
9
-
10
-
11
-
12
-
13
-
14
-
15
-
16
-
17
-
18
-
19
-
20
-
21
-
22
-
23
-
24
-
25
-
26
-
27
-
28
-
29
-
30
-
31
-
32
-
33
-
34
-
35
-
36
-
37
-
38
-
39
-
40
-
41
-
42
-
43
-
44
-
45
-
46
-
47
-
48
-
49
-
50
-
51
-
52
-
53
-
54
-
55
-
56
-
57
-
58
-
59
-
60
-
61
-
62
-
63
-
64
-
65
-
66
-
67
-
68
-
69
-
70
-
71
-
72
-
73
-
74
-
75
-
76
-
77
-
78
-
79
-
80
-
81
-
82
-
83
-
84
-
85
-
86
-
87
-
88
-
89
-
90
-
91
-
92
-
93
-
94
-
95
-
96
-
97
-
98
-
99
-
100
-
101
-
102
-
103
-
104
-
105
-
106
-
107
-
108
-
109
-
110
-
111
-
112
-
113
-
114
-
115
-
116
-
117
-
118
-
119
-
120
-
121
-
122
-
123
-
124
-
125
-
126
-
127
-
128
-
129
-
130
-
131
-
132
-
133
-
134
-
135
-
136
-
137
-
138
-
139
-
140
-
141
-
142
-
143
-
144
-
145
-
146
-
147
-
148
-
149
-
150
-
151
-
152
-
153
-
154
-
155
-
156
-
157
-
158
-
159
-
160
-
161
-
162
-
163
-
164
-
165
-
166
-
167
-
168
-
169
-
170
-
171
-
172
-
173
-
174
-
175
-
176
-
177
-
178
-
179
-
180
-
181
-
182
-
183
-
184
-
185
-
186
-
187
-
188
-
189
-
190
-
191
-
192
-
193
-
194
-
195
-
196
-
197
-
198
-
199
-
200
-
201
-
202
-
203
-
204
-
205
-
206
-
207
-
208
-
209
-
210
-
211
-
212
-
213
-
214
-
215
-
216
-
217
-
218
-
219
-
220
-
221
-
222
-
223
-
224
-
225
-
226
-
227
-
228
-
229
-
230
-
231
-
232
-
233
-
234
-
235
-
236
-
237
-
238
-
239
-
240
-
241
-
242
-
243
-
244
-
245
-
246
-
247
-
248
-
249
-
250
-
251
-
252
-
253
-
254
-
255
-
256
-
257
-
258
-
259
-
260
-
261
-
262
-
263
-
264
-
265
-
266
-
267
-
268
-
269
-
270
-
271
-
272
-
273
-
 274
274 -
 275
275 -
 276
276 -
 277
277 -
 278
278 -
 279
279 -
 280
280 -
 281
281 -
 282
282 -
 283
283 -
 284
284 -
 285
285 -
 286
286 -
 287
287 -
 288
288 -
 289
289 -
 290
290 -
 291
291 -
 292
292 -
 293
293 -
 294
294 -
295
-
296
-
297
-
298
-
299
-
300
-
301
-
302
-
303
-
304
-
305
-
306
-
307
-
308
-
309
-
310
-
311
-
312
-
313
-
314
-
315
-
316
-
317
-
318
-
319
-
320
-
321
-
322
-
323
-
324
-
325
-
326
-
327
-
328
-
329
-
330
-
331
-
332
-
333
-
334
-
335
-
336
-
337
-
338
-
339
-
340
-
341
-
342
-
343
-
344
-
345
-
346
-
347
-
348
-
349
-
350
-
351
-
352
-
353
-
354
-
355
-
356
-
357
-
358
-
359
-
360
-
361
-
362
-
363
-
364
-
365
-
366
-
367
-
368
-
369
-
370
-
371
-
372
-
373
-
374
-
375
-
376
-
377
-
378
-
379
-
380
-
381
-
382
-
383
-
384
-
385
-
386
-
387
-
388
-
389
-
390
-
391
-
392
-
393
-
394
-
395
-
396
 |
 |

HSBC HOLDINGS PLC
Notes on the Financial Statements (continued)
7 – Employee compensation and benefits
282
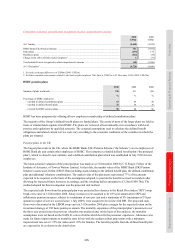
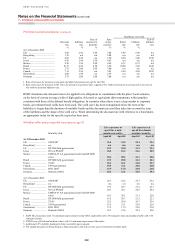
Principal actuarial assumptions (continued)
Healthcare cost trend
Discount
rate
Inflation
rate
Rate of
increase for
pensions1
Rate
of pay
increase
Initial
rate
Ultimate
rate
Year of
ultimate
rate
% % % % % %
At 31 December 2008
UK2 ............................................. 6.50 2.90 3.00 3.40 6.90 6.90 n/a
Hong Kong ................................. 1.19 n/a n/a 5.00 n/a n/a n/a
US ............................................... 6.05 2.50 n/a 3.50 8.90 5.00 2018
Jersey .......................................... 6.50 2.90 2.90 4.65 n/a n/a n/a
Mexico ........................................ 8.10 3.50 2.00 4.50 6.75 6.75 n/a
Brazil ........................................... 10.75 4.50 4.50 5.50 10.00 5.50 2018
France ......................................... 5.75 2.00 2.00 3.00 n/a n/a n/a
Canada ........................................ 7.19 2.50 n/a 3.85 8.20 4.90 2012
Switzerland ................................. 2.60 1.50 n/a 2.39 n/a n/a n/a
Germany ...................................... 5.75 2.00 2.00 3.00 n/a n/a n/a
1 Rate of increase for pensions in payment and deferred pensions (except for the UK).
2 Rate of increase for pensions in the UK is for pensions in payment only, capped at 5%. Deferred pensions are projected to increase in
line with the assumed inflation rate.
HSBC determines the discount rates to be applied to its obligations in consultation with the plans’ local actuaries,
on the basis of current average yields of high quality (AA rated or equivalent) debt instruments, with maturities
consistent with those of the defined benefit obligations. In countries where there is not a deep market in corporate
bonds, government bond yields have been used. The yield curve has been extrapolated where the term of the
liabilities is longer than the duration of available bonds and the discount rate used then takes into account the term
of the liabilities and the shape of the yield curve. When determining the discount rate with reference to a bond index,
an appropriate index for the specific region has been used.
Mortality tables and average life expectancy at age 65
Mortality table
Life expectancy at
age 65 for a male
member currently:
Life expectancy at
age 65 for a female
member currently:
Aged 65 Aged 45 Aged 65 Aged 45
At 31 December 2010
UK ................................. SAPS MC1 22.4 24.3 23.4 25.3
Hong Kong4 .................. n/a n/a n/a n/a n/a
US ................................. RP 2000 fully generational 19.3 20.8 21.2 22.1
Jersey ............................ 80% of PNA002 24.2 26.2 26.6 28.5
Mexico .......................... EMSSA-97 AA generational scale from RP 2000
series 18.6 20.1 21.1 22.0
Brazil ............................. RP 2000 fully generational 19.3 20.8 21.2 22.1
France ........................... TG 05 23.4 26.1 26.8 29.7
Canada .......................... UP94 generational 19.5 21.1 22.0 22.8
Switzerland ................... BVG 20053 17.9 17.9 21.0 21.0
Germany ........................ Heubeck 2005 G 18.4 21.1 22.5 25.1
At 31 December 2009
UK ................................. SAPS MC1 22.3 24.2 23.3 25.2
Hong Kong4 .................. n/a n/a n/a n/a n/a
US ................................. RP 2000 fully generational 19.2 20.7 21.2 22.1
Jersey ............................ 80% of PNA002 24.1 26.1 26.5 28.4
Mexico .......................... EMSSA-97 AA generational scale from RP 2000
series 18.5 20.1 21.1 22.0
Brazil ............................. RP 2000 fully generational 19.2 20.7 21.2 22.1
France ........................... TG 05 23.2 26.0 26.7 29.6
Canada .......................... UP94 generational 19.5 21.1 22.0 22.8
Switzerland ................... BVG 20053 17.9 17.9 21.0 21.0
Germany ........................ Heubeck 2005 G 18.3 21.0 22.4 25.0
1 SAPS MC projections with 1% minimum improvement beyond 2002. Light table with 1.08 rating for male and standard table with 1.06
rating for female.
2 PNA00 year of birth and medium cohort with 1% minimum improvement thereafter.
3 Additional 8.5% liability loading for future mortality improvements.
4 The significant plans in Hong Kong are lump sum plans which do not use a post-retirement mortality table.