HSBC 2010 Annual Report Download - page 18
Download and view the complete annual report
Please find page 18 of the 2010 HSBC annual report below. You can navigate through the pages in the report by either clicking on the pages listed below, or by using the keyword search tool below to find specific information within the annual report.-
 1
1 -
2
-
3
-
4
-
5
-
6
-
7
-
 8
8 -
 9
9 -
 10
10 -
 11
11 -
 12
12 -
 13
13 -
 14
14 -
 15
15 -
 16
16 -
 17
17 -
 18
18 -
 19
19 -
 20
20 -
 21
21 -
 22
22 -
 23
23 -
 24
24 -
 25
25 -
 26
26 -
 27
27 -
 28
28 -
29
-
30
-
31
-
32
-
33
-
34
-
35
-
36
-
37
-
38
-
39
-
40
-
41
-
42
-
43
-
44
-
45
-
46
-
47
-
48
-
49
-
50
-
51
-
52
-
53
-
54
-
55
-
56
-
57
-
58
-
59
-
60
-
61
-
62
-
63
-
64
-
65
-
66
-
67
-
68
-
69
-
70
-
71
-
72
-
73
-
74
-
75
-
76
-
77
-
78
-
79
-
80
-
81
-
82
-
83
-
84
-
85
-
86
-
87
-
88
-
89
-
90
-
91
-
92
-
93
-
94
-
95
-
96
-
97
-
98
-
99
-
100
-
101
-
102
-
103
-
104
-
105
-
106
-
107
-
108
-
109
-
110
-
111
-
112
-
113
-
114
-
115
-
116
-
117
-
118
-
119
-
120
-
121
-
122
-
123
-
124
-
125
-
126
-
127
-
128
-
129
-
130
-
131
-
132
-
133
-
134
-
135
-
136
-
137
-
138
-
139
-
140
-
141
-
142
-
143
-
144
-
145
-
146
-
147
-
148
-
149
-
150
-
151
-
152
-
153
-
154
-
155
-
156
-
157
-
158
-
159
-
160
-
161
-
162
-
163
-
164
-
165
-
166
-
167
-
168
-
169
-
170
-
171
-
172
-
173
-
174
-
175
-
176
-
177
-
178
-
179
-
180
-
181
-
182
-
183
-
184
-
185
-
186
-
187
-
188
-
189
-
190
-
191
-
192
-
193
-
194
-
195
-
196
-
197
-
198
-
199
-
200
-
201
-
202
-
203
-
204
-
205
-
206
-
207
-
208
-
209
-
210
-
211
-
212
-
213
-
214
-
215
-
216
-
217
-
218
-
219
-
220
-
221
-
222
-
223
-
224
-
225
-
226
-
227
-
228
-
229
-
230
-
231
-
232
-
233
-
234
-
235
-
236
-
237
-
238
-
239
-
240
-
241
-
242
-
243
-
244
-
245
-
246
-
247
-
248
-
249
-
250
-
251
-
252
-
253
-
254
-
255
-
256
-
257
-
258
-
259
-
260
-
261
-
262
-
263
-
264
-
265
-
266
-
267
-
268
-
269
-
270
-
271
-
272
-
273
-
274
-
275
-
276
-
277
-
278
-
279
-
280
-
281
-
282
-
283
-
284
-
285
-
286
-
287
-
288
-
289
-
290
-
291
-
292
-
293
-
294
-
295
-
296
-
297
-
298
-
299
-
300
-
301
-
302
-
303
-
304
-
305
-
306
-
307
-
308
-
309
-
310
-
311
-
312
-
313
-
314
-
315
-
316
-
317
-
318
-
319
-
320
-
321
-
322
-
323
-
324
-
325
-
326
-
327
-
328
-
329
-
330
-
331
-
332
-
333
-
334
-
335
-
336
-
337
-
338
-
339
-
340
-
341
-
342
-
343
-
344
-
345
-
346
-
347
-
348
-
349
-
350
-
351
-
352
-
353
-
354
-
355
-
356
-
357
-
358
-
359
-
360
-
361
-
362
-
363
-
364
-
365
-
366
-
367
-
368
-
369
-
370
-
371
-
372
-
373
-
374
-
375
-
376
-
377
-
378
-
379
-
380
-
381
-
382
-
383
-
384
-
385
-
386
-
387
-
388
-
389
-
390
-
391
-
392
-
393
-
394
-
395
-
396
 |
 |

HSBC HOLDINGS PLC
Report of the Directors: Operating and Financial Review (continued)
Financial summary > Income statement
16
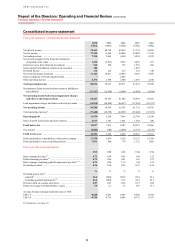
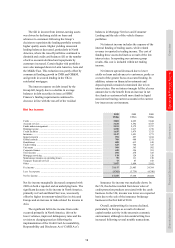
Consolidated income statement
Five-year summary consolidated income statement
2010
US$m
2009
US$m
2008
US$m
2007
US$m
2006
US$m
Net interest income ...................................................................... 39,441 40,730 42,563 37,795 34,486
Net fee income ............................................................................. 17,355 17,664 20,024 22,002 17,182
Net trading income ...................................................................... 7,210 9,863 6,560 9,834 8,222
Net income/(expense) from financial instruments
designated at fair value ........................................................... 1,220 (3,531) 3,852 4,083 657
Gains less losses from financial investments .............................. 968 520 197 1,956 969
Gains arising from dilution of interests in associates ................. 188 – – 1,092 –
Dividend income .......................................................................... 112 126 272 324 340
Net earned insurance premiums .................................................. 11,146 10,471 10,850 9,076 5,668
Gains on disposal of French regional banks ............................... – – 2,445 – –
Other operating income ............................................................... 2,374 2,788 1,808 1,439 2,546
Total operating income ............................................................. 80,014 78,631 88,571 87,601 70,070
Net insurance claims incurred and movement in liabilities to
policyholders ................................................................................ (11,767) (12,450) (6,889) (8,608) (4,704)
Net operating income before loan impairment charges
and other credit risk provisions .......................................... 68,247 66,181 81,682 78,993 65,366
Loan impairment charges and other credit risk provisions ......... (14,039) (26,488) (24,937) (17,242) (10,573)
Net operating income ................................................................ 54,208 39,693 56,745 61,751 54,793
Total operating expenses17 ........................................................... (37,688) (34,395) (49,099) (39,042) (33,553)
Operating profit ......................................................................... 16,520 5,298 7,646 22,709 21,240
Share of profit in associates and joint ventures ........................... 2,517 1,781 1,661 1,503 846
Profit before tax ......................................................................... 19,037 7,079 9,307 24,212 22,086
Tax expense ................................................................................. (4,846) (385) (2,809) (3,757) (5,215)
Profit for the year ...................................................................... 14,191 6,694 6,498 20,455 16,871
Profit attributable to shareholders of the parent company .......... 13,159 5,834 5,728 19,133 15,789
Profit attributable to non-controlling interests ............................ 1,032 860 770 1,322 1,082
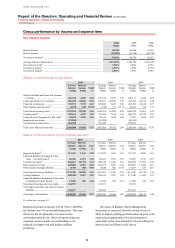
Five-year financial information
US$ US$ US$ US$ US$
Basic earnings per share18 ............................................................ 0.73 0.34 0.41 1.44 1.22
Diluted earnings per share18 ......................................................... 0.72 0.34 0.41 1.42 1.21
Basic earnings excluding goodwill impairment per share17,18 ..... 0.73 0.34 1.19 1.44 1.22
Dividends per share1 .................................................................... 0.34 0.34 0.93 0.87 0.76
% % % % %
Dividend payout ratio19 ...............................................................
– reported16 .................................................................................. 46.6 100.0 226.8 60.4 62.3
– excluding goodwill impairment17,18 .......................................... 46.6 100.0 78.2 60.4 62.3
Post-tax return on average total assets ........................................ 0.57 0.27 0.26 0.97 1.00
Return on average total shareholders’ equity .............................. 9.5 5.1 4.7 15.9 15.7
Average foreign exchange translation rates to US$:
US$1: £ ........................................................................................ 0.648 0.641 0.545 0.500 0.543
US$1: € ........................................................................................ 0.755 0.719 0.684 0.731 0.797
For footnotes, see page 83.