HSBC 2010 Annual Report Download - page 39
Download and view the complete annual report
Please find page 39 of the 2010 HSBC annual report below. You can navigate through the pages in the report by either clicking on the pages listed below, or by using the keyword search tool below to find specific information within the annual report.-
 1
1 -
2
-
3
-
4
-
5
-
6
-
7
-
8
-
9
-
10
-
11
-
12
-
13
-
14
-
15
-
16
-
17
-
18
-
19
-
20
-
21
-
22
-
23
-
24
-
25
-
26
-
27
-
28
-
 29
29 -
 30
30 -
 31
31 -
 32
32 -
 33
33 -
 34
34 -
 35
35 -
 36
36 -
 37
37 -
 38
38 -
 39
39 -
 40
40 -
 41
41 -
 42
42 -
 43
43 -
 44
44 -
 45
45 -
 46
46 -
 47
47 -
 48
48 -
 49
49 -
50
-
51
-
52
-
53
-
54
-
55
-
56
-
57
-
58
-
59
-
60
-
61
-
62
-
63
-
64
-
65
-
66
-
67
-
68
-
69
-
70
-
71
-
72
-
73
-
74
-
75
-
76
-
77
-
78
-
79
-
80
-
81
-
82
-
83
-
84
-
85
-
86
-
87
-
88
-
89
-
90
-
91
-
92
-
93
-
94
-
95
-
96
-
97
-
98
-
99
-
100
-
101
-
102
-
103
-
104
-
105
-
106
-
107
-
108
-
109
-
110
-
111
-
112
-
113
-
114
-
115
-
116
-
117
-
118
-
119
-
120
-
121
-
122
-
123
-
124
-
125
-
126
-
127
-
128
-
129
-
130
-
131
-
132
-
133
-
134
-
135
-
136
-
137
-
138
-
139
-
140
-
141
-
142
-
143
-
144
-
145
-
146
-
147
-
148
-
149
-
150
-
151
-
152
-
153
-
154
-
155
-
156
-
157
-
158
-
159
-
160
-
161
-
162
-
163
-
164
-
165
-
166
-
167
-
168
-
169
-
170
-
171
-
172
-
173
-
174
-
175
-
176
-
177
-
178
-
179
-
180
-
181
-
182
-
183
-
184
-
185
-
186
-
187
-
188
-
189
-
190
-
191
-
192
-
193
-
194
-
195
-
196
-
197
-
198
-
199
-
200
-
201
-
202
-
203
-
204
-
205
-
206
-
207
-
208
-
209
-
210
-
211
-
212
-
213
-
214
-
215
-
216
-
217
-
218
-
219
-
220
-
221
-
222
-
223
-
224
-
225
-
226
-
227
-
228
-
229
-
230
-
231
-
232
-
233
-
234
-
235
-
236
-
237
-
238
-
239
-
240
-
241
-
242
-
243
-
244
-
245
-
246
-
247
-
248
-
249
-
250
-
251
-
252
-
253
-
254
-
255
-
256
-
257
-
258
-
259
-
260
-
261
-
262
-
263
-
264
-
265
-
266
-
267
-
268
-
269
-
270
-
271
-
272
-
273
-
274
-
275
-
276
-
277
-
278
-
279
-
280
-
281
-
282
-
283
-
284
-
285
-
286
-
287
-
288
-
289
-
290
-
291
-
292
-
293
-
294
-
295
-
296
-
297
-
298
-
299
-
300
-
301
-
302
-
303
-
304
-
305
-
306
-
307
-
308
-
309
-
310
-
311
-
312
-
313
-
314
-
315
-
316
-
317
-
318
-
319
-
320
-
321
-
322
-
323
-
324
-
325
-
326
-
327
-
328
-
329
-
330
-
331
-
332
-
333
-
334
-
335
-
336
-
337
-
338
-
339
-
340
-
341
-
342
-
343
-
344
-
345
-
346
-
347
-
348
-
349
-
350
-
351
-
352
-
353
-
354
-
355
-
356
-
357
-
358
-
359
-
360
-
361
-
362
-
363
-
364
-
365
-
366
-
367
-
368
-
369
-
370
-
371
-
372
-
373
-
374
-
375
-
376
-
377
-
378
-
379
-
380
-
381
-
382
-
383
-
384
-
385
-
386
-
387
-
388
-
389
-
390
-
391
-
392
-
393
-
394
-
395
-
396
 |
 |

37
Overview Operating & Financial Review Governance Financial Statements Shareholder Information
Customer groups and global
businesses
Page
Summary ................................................................... 37
Products and services ............................................... 38
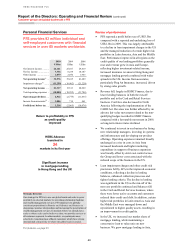
Personal Financial Services ...................................... 40
Commercial Banking ................................................ 42
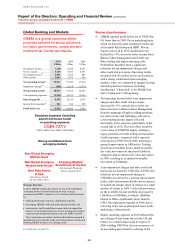
Global Banking and Markets .................................... 44
Global Private Banking ............................................ 46
Other ......................................................................... 47
Analysis by customer group and global business ..... 48
Basis of preparation
The results are presented in accordance with the accounting
policies used in the preparation of HSBC’s consolidated
financial statements. Our operations are closely integrated and,
accordingly, the presentation of customer group and global
business data includes internal allocations of certain items of
income and expense. These allocations include the costs of
certain support services and GMO functions, to the extent that
these can be meaningfully attributed to operational business
lines. While such allocations have been made on a systematic
and consistent basis, they necessarily involve a degree of
subjectivity.
Where relevant, income and expense amounts presented
include the results of inter-segment funding as well as inter-
company and inter-business line transactions. All such
transactions are undertaken on arm’s length terms.
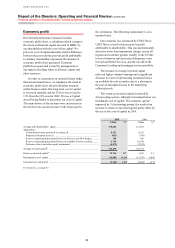
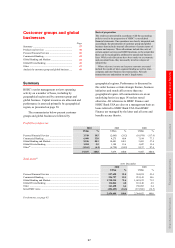
Summary
HSBC’s senior management reviews operating
activity on a number of bases, including by
geographical region and by customer group and
global business. Capital resources are allocated and
performance is assessed primarily by geographical
region, as presented on page 50.
The commentaries below present customer
groups and global businesses followed by
geographical regions. Performance is discussed in
this order because certain strategic themes, business
initiatives and trends affect more than one
geographical region. All commentaries are on an
underlying basis (see page 14) unless stated
otherwise. All references to HSBC Finance and
HSBC Bank USA are also on a management basis as
loans referred to HSBC Bank USA from HSBC
Finance are managed by the latter and all costs and
benefits accrue thereto.
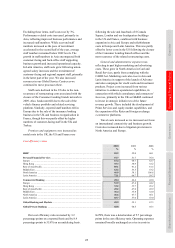
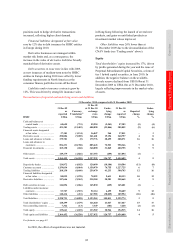
Profit/(loss) before tax
2010 2009 2008
US$m % US$m % US$m %
Personal Financial Services ..................................... 3,518 18.5 (2,065) (29.2) (10,974) (117.9)
Commercial Banking ............................................... 6,090 32.0 4,275 60.4 7,194 77.3
Global Banking and Markets ................................... 9,536 50.1 10,481 148.1 3,483 37.4
Global Private Banking ........................................... 1,054 5.5 1,108 15.6 1,447 15.6
Other44 ...................................................................... (1,161) (6.1) (6,720) (94.9) 8,157 87.6
19,037 100.0 7,079 100.0 9,307 100.0
Total assets45
At 31 December
2010 2009
US$m % US$m %
Personal Financial Services .................................................................................... 527,698 21.5 554,074 23.4
Commercial Banking .............................................................................................. 296,797 12.1 251,143 10.6
Global Banking and Markets .................................................................................. 1,758,315 71.6 1,683,672 71.2
Global Private Banking .......................................................................................... 116,846 4.8 116,148 4.9
Other ....................................................................................................................... 161,458 6.6 150,983 6.4
Intra-HSBC items ................................................................................................... (406,425) (16.6) (391,568) (16.5)
2,454,689 100.0 2,364,452 100.0
For footnotes, see page 83.