HSBC 2010 Annual Report Download - page 138
Download and view the complete annual report
Please find page 138 of the 2010 HSBC annual report below. You can navigate through the pages in the report by either clicking on the pages listed below, or by using the keyword search tool below to find specific information within the annual report.-
 1
1 -
2
-
3
-
4
-
5
-
6
-
7
-
8
-
9
-
10
-
11
-
12
-
13
-
14
-
15
-
16
-
17
-
18
-
19
-
20
-
21
-
22
-
23
-
24
-
25
-
26
-
27
-
28
-
29
-
30
-
31
-
32
-
33
-
34
-
35
-
36
-
37
-
38
-
39
-
40
-
41
-
42
-
43
-
44
-
45
-
46
-
47
-
48
-
49
-
50
-
51
-
52
-
53
-
54
-
55
-
56
-
57
-
58
-
59
-
60
-
61
-
62
-
63
-
64
-
65
-
66
-
67
-
68
-
69
-
70
-
71
-
72
-
73
-
74
-
75
-
76
-
77
-
78
-
79
-
80
-
81
-
82
-
83
-
84
-
85
-
86
-
87
-
88
-
89
-
90
-
91
-
92
-
93
-
94
-
95
-
96
-
97
-
98
-
99
-
100
-
101
-
102
-
103
-
104
-
105
-
106
-
107
-
108
-
109
-
110
-
111
-
112
-
113
-
114
-
115
-
116
-
117
-
118
-
119
-
120
-
121
-
122
-
123
-
124
-
125
-
126
-
127
-
 128
128 -
 129
129 -
 130
130 -
 131
131 -
 132
132 -
 133
133 -
 134
134 -
 135
135 -
 136
136 -
 137
137 -
 138
138 -
 139
139 -
 140
140 -
 141
141 -
 142
142 -
 143
143 -
 144
144 -
 145
145 -
 146
146 -
 147
147 -
 148
148 -
149
-
150
-
151
-
152
-
153
-
154
-
155
-
156
-
157
-
158
-
159
-
160
-
161
-
162
-
163
-
164
-
165
-
166
-
167
-
168
-
169
-
170
-
171
-
172
-
173
-
174
-
175
-
176
-
177
-
178
-
179
-
180
-
181
-
182
-
183
-
184
-
185
-
186
-
187
-
188
-
189
-
190
-
191
-
192
-
193
-
194
-
195
-
196
-
197
-
198
-
199
-
200
-
201
-
202
-
203
-
204
-
205
-
206
-
207
-
208
-
209
-
210
-
211
-
212
-
213
-
214
-
215
-
216
-
217
-
218
-
219
-
220
-
221
-
222
-
223
-
224
-
225
-
226
-
227
-
228
-
229
-
230
-
231
-
232
-
233
-
234
-
235
-
236
-
237
-
238
-
239
-
240
-
241
-
242
-
243
-
244
-
245
-
246
-
247
-
248
-
249
-
250
-
251
-
252
-
253
-
254
-
255
-
256
-
257
-
258
-
259
-
260
-
261
-
262
-
263
-
264
-
265
-
266
-
267
-
268
-
269
-
270
-
271
-
272
-
273
-
274
-
275
-
276
-
277
-
278
-
279
-
280
-
281
-
282
-
283
-
284
-
285
-
286
-
287
-
288
-
289
-
290
-
291
-
292
-
293
-
294
-
295
-
296
-
297
-
298
-
299
-
300
-
301
-
302
-
303
-
304
-
305
-
306
-
307
-
308
-
309
-
310
-
311
-
312
-
313
-
314
-
315
-
316
-
317
-
318
-
319
-
320
-
321
-
322
-
323
-
324
-
325
-
326
-
327
-
328
-
329
-
330
-
331
-
332
-
333
-
334
-
335
-
336
-
337
-
338
-
339
-
340
-
341
-
342
-
343
-
344
-
345
-
346
-
347
-
348
-
349
-
350
-
351
-
352
-
353
-
354
-
355
-
356
-
357
-
358
-
359
-
360
-
361
-
362
-
363
-
364
-
365
-
366
-
367
-
368
-
369
-
370
-
371
-
372
-
373
-
374
-
375
-
376
-
377
-
378
-
379
-
380
-
381
-
382
-
383
-
384
-
385
-
386
-
387
-
388
-
389
-
390
-
391
-
392
-
393
-
394
-
395
-
396
 |
 |

HSBC HOLDINGS PLC
Report of the Directors: Operating and Financial Review (continued)
Risk > Credit risk > Securitisation exposures and other structured products
136
Analysis of exposures and significant
movements
(Audited)
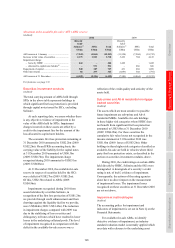
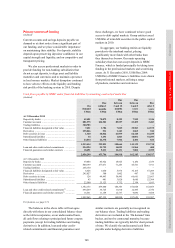
Sub-prime residential mortgage-related assets
Sub-prime residential mortage-related assets
included US$3.1bn (2009: US$3.7bn) related to
US-originated assets and US$1.1bn (2009:
US$1.1bn) relating to UK non-conforming
residential mortgage-related assets. Of the non-high
grade assets held of US$1.7bn (2009: US$1.7bn),
US$1.5bn (2009: US$1.6bn) related to US-
originated assets, reflecting the higher quality of
the UK-originated assets.
A modest increase in observable values of our
sub-prime assets took place in 2010. Further net
impairment of US$48m on assets classified as
available for sale was recognised in 2010 (2009:
US$559m) as losses were incurred under current
accounting impairment rules. Our expectation of
cash losses on the underlying assets did not increase
from that at 31 December 2009. Of the above
impairment, US$54m (2009: US$312m) occurred in
the SICs and was borne by the capital note holders.
US Alt-A residential mortgage-related assets
During 2010, spreads on Alt-A mortgage-related
assets tightened modestly from the levels seen in
2009. Further impairments of US$884m (2009:
US$1,372m) were recorded in respect of Alt-A
mortgage-related assets as losses were incurred
under the accounting rules described in the
paragraph above, without reference to the amount
of expected loss. Our expectation of losses in the
underlying assets did not increase from that at
31 December 2009. Of the impairment above,
US$450m (2009: US$346m) occurred in the
SICs and was borne by the capital note holders.
The downgrade of our US Alt-A residential
MBSs is reflected in the disclosure of fair value
movements in the above tables as if the downgrade
had taken effect on 1 January 2010.
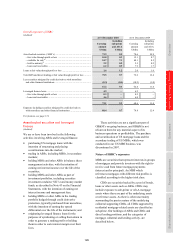
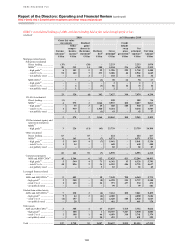
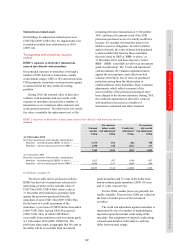
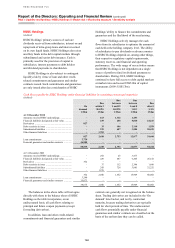
The following table shows the vintages of the
collateral assets supporting our holdings of US
sub-prime and Alt-A MBSs. Market prices for these
instruments generally incorporate higher discounts
for later vintages. The majority of our holdings of
US sub-prime MBSs originated pre-2007; holdings
of US Alt-A MBSs are more evenly distributed
between pre-2007 vintages and those from 2007
onwards.
Vintages of US sub-prime and Alt-A mortgage-backed securities
(Audited)
Gross principal47 of US sub-prime
mortgage-backed securities
at 31 December
Gross principal47 of US Alt-A
mortgage-backed securities
at 31 December
2010 2009 2010 2009
US$m US$m US$m US$m
Mortgage vintage
Pre-2006 ........................................................................................ 1,061 1,748 1,159 2,108
2006 .............................................................................................. 1,822 2,827 5,147 6,225
2007 .............................................................................................. 979 1,187 3,651 5,213
3,862 5,762 9,957 13,546
For footnote, see page 174.
US Government agency and sponsored
enterprises mortgage-related assets
During 2010, we increased our holdings of US
Government agency and sponsored enterprises
mortgage-related assets by US$8.3bn.
Other residential mortgage-related assets
The majority of our other residential
mortgage-related assets were originated in the UK
(2010: US$3.9bn; 2009: US$4.7bn). No impairments
were recognised in respect of these UK originated
assets in 2010 (2009: nil), reflecting credit support
within the asset portfolio.
Commercial property mortgage-related assets
Of our total of US$10.5bn (2009: US$10.0bn)
of commercial property mortgage-related assets,
US$5.2bn related to US originated assets (2009:
US$4.3bn). Spreads tightened on both US and non-
US commercial property mortgage-related assets
during 2010. Impairments of US$5m (2009:
US$88m) were recognised in 2010.
Leveraged finance-related assets
The majority of these assets related to US-originated
exposures; 90% (2009: 94%) were high grade with
no impairments recorded in the year (2009: nil).