HSBC 2010 Annual Report Download - page 183
Download and view the complete annual report
Please find page 183 of the 2010 HSBC annual report below. You can navigate through the pages in the report by either clicking on the pages listed below, or by using the keyword search tool below to find specific information within the annual report.-
 1
1 -
2
-
3
-
4
-
5
-
6
-
7
-
8
-
9
-
10
-
11
-
12
-
13
-
14
-
15
-
16
-
17
-
18
-
19
-
20
-
21
-
22
-
23
-
24
-
25
-
26
-
27
-
28
-
29
-
30
-
31
-
32
-
33
-
34
-
35
-
36
-
37
-
38
-
39
-
40
-
41
-
42
-
43
-
44
-
45
-
46
-
47
-
48
-
49
-
50
-
51
-
52
-
53
-
54
-
55
-
56
-
57
-
58
-
59
-
60
-
61
-
62
-
63
-
64
-
65
-
66
-
67
-
68
-
69
-
70
-
71
-
72
-
73
-
74
-
75
-
76
-
77
-
78
-
79
-
80
-
81
-
82
-
83
-
84
-
85
-
86
-
87
-
88
-
89
-
90
-
91
-
92
-
93
-
94
-
95
-
96
-
97
-
98
-
99
-
100
-
101
-
102
-
103
-
104
-
105
-
106
-
107
-
108
-
109
-
110
-
111
-
112
-
113
-
114
-
115
-
116
-
117
-
118
-
119
-
120
-
121
-
122
-
123
-
124
-
125
-
126
-
127
-
128
-
129
-
130
-
131
-
132
-
133
-
134
-
135
-
136
-
137
-
138
-
139
-
140
-
141
-
142
-
143
-
144
-
145
-
146
-
147
-
148
-
149
-
150
-
151
-
152
-
153
-
154
-
155
-
156
-
157
-
158
-
159
-
160
-
161
-
162
-
163
-
164
-
165
-
166
-
167
-
168
-
169
-
170
-
171
-
172
-
 173
173 -
 174
174 -
 175
175 -
 176
176 -
 177
177 -
 178
178 -
 179
179 -
 180
180 -
 181
181 -
 182
182 -
 183
183 -
 184
184 -
 185
185 -
 186
186 -
 187
187 -
 188
188 -
 189
189 -
 190
190 -
 191
191 -
 192
192 -
 193
193 -
194
-
195
-
196
-
197
-
198
-
199
-
200
-
201
-
202
-
203
-
204
-
205
-
206
-
207
-
208
-
209
-
210
-
211
-
212
-
213
-
214
-
215
-
216
-
217
-
218
-
219
-
220
-
221
-
222
-
223
-
224
-
225
-
226
-
227
-
228
-
229
-
230
-
231
-
232
-
233
-
234
-
235
-
236
-
237
-
238
-
239
-
240
-
241
-
242
-
243
-
244
-
245
-
246
-
247
-
248
-
249
-
250
-
251
-
252
-
253
-
254
-
255
-
256
-
257
-
258
-
259
-
260
-
261
-
262
-
263
-
264
-
265
-
266
-
267
-
268
-
269
-
270
-
271
-
272
-
273
-
274
-
275
-
276
-
277
-
278
-
279
-
280
-
281
-
282
-
283
-
284
-
285
-
286
-
287
-
288
-
289
-
290
-
291
-
292
-
293
-
294
-
295
-
296
-
297
-
298
-
299
-
300
-
301
-
302
-
303
-
304
-
305
-
306
-
307
-
308
-
309
-
310
-
311
-
312
-
313
-
314
-
315
-
316
-
317
-
318
-
319
-
320
-
321
-
322
-
323
-
324
-
325
-
326
-
327
-
328
-
329
-
330
-
331
-
332
-
333
-
334
-
335
-
336
-
337
-
338
-
339
-
340
-
341
-
342
-
343
-
344
-
345
-
346
-
347
-
348
-
349
-
350
-
351
-
352
-
353
-
354
-
355
-
356
-
357
-
358
-
359
-
360
-
361
-
362
-
363
-
364
-
365
-
366
-
367
-
368
-
369
-
370
-
371
-
372
-
373
-
374
-
375
-
376
-
377
-
378
-
379
-
380
-
381
-
382
-
383
-
384
-
385
-
386
-
387
-
388
-
389
-
390
-
391
-
392
-
393
-
394
-
395
-
396
 |
 |

181
Overview Operating & Financial Review Governance Financial Statements Shareholder Information
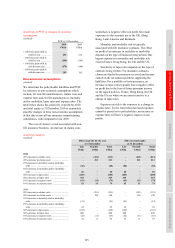
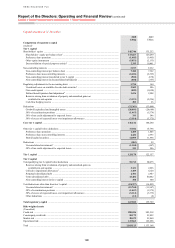
2010 2009
% %
Capital ratios
(Unaudited)
Core tier 1 ratio ......................................................................................................................................... 10.5 9.4
Tier 1 ratio ................................................................................................................................................ 12.1 10.8
Total capital ratio ...................................................................................................................................... 15.2 13.7
For footnotes, see page 182.
Source and application of tier 1 capital
2010
US$m
2009
US$m
Movement in tier 1 capital
(Audited)
Opening tier 1 capital ............................................................................................................................... 122,157 95,336
Contribution to tier 1 capital from profit for the year .......................................................................... 13,218 10,247
Consolidated profits attributable to shareholders of the parent company ........................................... 13,159 5,834
Removal of own credit spread net of tax ............................................................................................. 59 4,413
Net dividends ............................................................................................................................................ (3,827) (3,969)
Dividends .............................................................................................................................................. (6,350) (5,639)
Add back: shares issued in lieu of dividends ....................................................................................... 2,523 1,670
Decrease/(increase) in goodwill and intangible assets deducted ............................................................. 679 (1,819)
Ordinary shares issued .............................................................................................................................. 180 18,399
Rights issue (net of expenses)7 ............................................................................................................. – 18,326
Other ..................................................................................................................................................... 180 73
Hybrid capital securities issued net of redemptions ................................................................................. 2,368 –
Foreign currency translation differences .................................................................................................. (526) 4,837
Other ......................................................................................................................................................... (1,070) (874)
Closing tier 1 capital ................................................................................................................................. 133,179 122,157
Movement in risk-weighted assets
(Unaudited)
At 1 January .............................................................................................................................................. 1,133,168 1,147,974
Movements ............................................................................................................................................... (30,055) (14,806)
At 31 December ........................................................................................................................................ 1,103,113 1,133,168
For footnotes, see page 182.
Movement in tier 1 capital
(Audited)
HSBC complied with the FSA’s capital adequacy
requirements throughout 2010 and 2009. Profits
attributable to shareholders of the parent company
increased capital by US$13.2bn, offset by net
dividends of US$3.8bn after taking account of shares
issued in lieu of dividends. Hybrid capital securities
issued, net of redemptions, increased tier 1 capital by
US$2.4bn.
Movement in risk-weighted assets
(Unaudited)
RWAs decreased by US$30.1bn or 3% in 2010.
Of this reduction, US$12.8bn was due to credit risk,
reflecting decreases in North America and Europe
offset by increases in Asia and Latin America. There
has been a decline in some North American retail
portfolio exposures as a result of run off. However,
the deterioration in the US economy and housing
market in recent years has resulted in increases in the
average risk weighting applicable to those portfolios
as we progressively captured the effects of these
events within the various Basel II model parameters.
Market risk RWAs decreased by US$13.2bn,
primarily due to reduced market volatility and
continuing exposure management.
Future developments
(Unaudited)
The regulation and supervision of financial
institutions continues to undergo significant
change in response to the global financial crisis.
In December 2010, the Basel Committee issued
final rules in two documents: A global regulatory
framework for more resilient banks and banking
systems and International framework for liquidity
risk measurement, standards and monitoring, which
together are commonly referred to as ‘Basel III’. The
new minimum capital requirements will be phased
in from 1 January 2013, with full implementation
required by 1 January 2019. The minimum common