HSBC 2010 Annual Report Download - page 167
Download and view the complete annual report
Please find page 167 of the 2010 HSBC annual report below. You can navigate through the pages in the report by either clicking on the pages listed below, or by using the keyword search tool below to find specific information within the annual report.-
 1
1 -
2
-
3
-
4
-
5
-
6
-
7
-
8
-
9
-
10
-
11
-
12
-
13
-
14
-
15
-
16
-
17
-
18
-
19
-
20
-
21
-
22
-
23
-
24
-
25
-
26
-
27
-
28
-
29
-
30
-
31
-
32
-
33
-
34
-
35
-
36
-
37
-
38
-
39
-
40
-
41
-
42
-
43
-
44
-
45
-
46
-
47
-
48
-
49
-
50
-
51
-
52
-
53
-
54
-
55
-
56
-
57
-
58
-
59
-
60
-
61
-
62
-
63
-
64
-
65
-
66
-
67
-
68
-
69
-
70
-
71
-
72
-
73
-
74
-
75
-
76
-
77
-
78
-
79
-
80
-
81
-
82
-
83
-
84
-
85
-
86
-
87
-
88
-
89
-
90
-
91
-
92
-
93
-
94
-
95
-
96
-
97
-
98
-
99
-
100
-
101
-
102
-
103
-
104
-
105
-
106
-
107
-
108
-
109
-
110
-
111
-
112
-
113
-
114
-
115
-
116
-
117
-
118
-
119
-
120
-
121
-
122
-
123
-
124
-
125
-
126
-
127
-
128
-
129
-
130
-
131
-
132
-
133
-
134
-
135
-
136
-
137
-
138
-
139
-
140
-
141
-
142
-
143
-
144
-
145
-
146
-
147
-
148
-
149
-
150
-
151
-
152
-
153
-
154
-
155
-
156
-
 157
157 -
 158
158 -
 159
159 -
 160
160 -
 161
161 -
 162
162 -
 163
163 -
 164
164 -
 165
165 -
 166
166 -
 167
167 -
 168
168 -
 169
169 -
 170
170 -
 171
171 -
 172
172 -
 173
173 -
 174
174 -
 175
175 -
 176
176 -
 177
177 -
178
-
179
-
180
-
181
-
182
-
183
-
184
-
185
-
186
-
187
-
188
-
189
-
190
-
191
-
192
-
193
-
194
-
195
-
196
-
197
-
198
-
199
-
200
-
201
-
202
-
203
-
204
-
205
-
206
-
207
-
208
-
209
-
210
-
211
-
212
-
213
-
214
-
215
-
216
-
217
-
218
-
219
-
220
-
221
-
222
-
223
-
224
-
225
-
226
-
227
-
228
-
229
-
230
-
231
-
232
-
233
-
234
-
235
-
236
-
237
-
238
-
239
-
240
-
241
-
242
-
243
-
244
-
245
-
246
-
247
-
248
-
249
-
250
-
251
-
252
-
253
-
254
-
255
-
256
-
257
-
258
-
259
-
260
-
261
-
262
-
263
-
264
-
265
-
266
-
267
-
268
-
269
-
270
-
271
-
272
-
273
-
274
-
275
-
276
-
277
-
278
-
279
-
280
-
281
-
282
-
283
-
284
-
285
-
286
-
287
-
288
-
289
-
290
-
291
-
292
-
293
-
294
-
295
-
296
-
297
-
298
-
299
-
300
-
301
-
302
-
303
-
304
-
305
-
306
-
307
-
308
-
309
-
310
-
311
-
312
-
313
-
314
-
315
-
316
-
317
-
318
-
319
-
320
-
321
-
322
-
323
-
324
-
325
-
326
-
327
-
328
-
329
-
330
-
331
-
332
-
333
-
334
-
335
-
336
-
337
-
338
-
339
-
340
-
341
-
342
-
343
-
344
-
345
-
346
-
347
-
348
-
349
-
350
-
351
-
352
-
353
-
354
-
355
-
356
-
357
-
358
-
359
-
360
-
361
-
362
-
363
-
364
-
365
-
366
-
367
-
368
-
369
-
370
-
371
-
372
-
373
-
374
-
375
-
376
-
377
-
378
-
379
-
380
-
381
-
382
-
383
-
384
-
385
-
386
-
387
-
388
-
389
-
390
-
391
-
392
-
393
-
394
-
395
-
396
 |
 |

165
Overview Operating & Financial Review Governance Financial Statements Shareholder Information
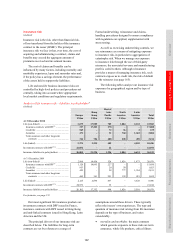
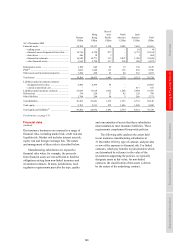
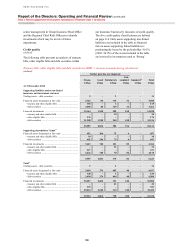
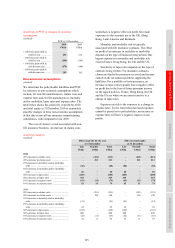
Sensitivity of HSBC’s insurance manufacturing subsidiaries to risk factors
(Audited)
2010 2009
Effect on
profit for
the year
Effect on
total
equity
Effect on
profit for
the year
Effect on
total
equity
US$m US$m US$m US$m
+ 100 basis points parallel shift in yield curves ........................... 72 (132) 68 (82)
– 100 basis points parallel shift in yield curves ........................... (86) 131 (69) 92
10% increase in equity prices ....................................................... 76 76 19 19
10% decrease in equity prices ...................................................... (76) (76) (20) (20)
10% increase in US dollar exchange rate
compared to all currencies ....................................................... 21 21 20 20
10% decrease in US dollar exchange rate
compared to all currencies ....................................................... (21) (21) (20) (20)
Sensitivity to credit spread increases ........................................... (31) (74) (36) (91)
Where appropriate, we include the impact of the
stress on the PVIF in the results of the stress tests.
The relationship between the values of certain assets
and liabilities and the risk factors may be non-linear
and, therefore, the results disclosed cannot be
extrapolated to measure sensitivities to different
levels of stress. The sensitivities are stated before
allowance for the effect of management actions
which may mitigate changes in market rates, and for
any factors such as policyholder behaviour that may
change in response to changes in market risk.
Credit risk
(Audited)
Description of credit risk
Credit risk can give rise to losses through default
and can lead to volatility in our income statement
and balance sheet figures through movements in
credit spreads, principally on the US$43.3bn (2009:
US$40.5bn) non-linked bond portfolio.
As tabulated above, the sensitivity of the net
profit after tax of our insurance subsidiaries to the
effects of increases in credit spreads is a fall of
US$31m (2009: US$36m fall). This is small because
51.4% of the financial assets held by our insurance
subsidiaries are classified as either held to maturity
or available for sale, and consequently any changes
in the fair value of these financial investments,
absent impairment, would have no impact on the
profit after tax. We calculate the sensitivity using
simplified assumptions based on a one-day
movement in credit spreads over a two-year period.
A confidence level of 99%, consistent with our
Group VAR, is applied. While credit spreads have
generally widened from the levels observed at the
end of 2009, the volatility experienced during 2010
was lower than that seen in 2009, leading to a
reduction in our sensitivity to credit spread
movements.
We used to sell certain unit-linked life insurance
contracts which were reinsured with a third-party
counterparty, who also underwrote market return
guarantees. We are exposed to credit risk to the
extent that the counterparty is unable to meet the
terms of the guaranteed benefits. The cost to us of
market return guarantees increases when interest
rates fall, equity markets fall or market volatility
increases. In addition, when determined by reference
to a discounted cash flow model in which the
discount rate is based on current interest rates,
guarantee costs increase in a falling interest rate
environment. The sale of these contracts ceased in
2008, reflecting our adjusted risk appetite.
How credit risk is managed
Our exposure to credit risk products is included in
the tables showing exposures to life and non-life
insurance risk on pages 157 to 159. Our insurance
manufacturing subsidiaries are responsible for the
credit risk, quality and performance of their
investment portfolios. Our assessment of the
creditworthiness of issuers and counterparties is
based primarily upon internationally recognised
credit ratings and other publicly available
information.
Investment credit exposures are monitored
against limits by our local insurance manufacturing
subsidiaries, and are aggregated and reported to
Group Credit Risk, the Group Insurance Credit Risk
Meeting and the Group Insurance Risk Committee.
Stress testing is performed by Group Insurance Head
Office on the investment credit exposures using
credit spread sensitivities and default probabilities.
The stresses are reported to the Group Insurance
Risk Committee.
We use a number of tools to manage and
monitor credit risk. These include an Early Warning
Report and a watch list of investments with current
credit concerns which are circulated fortnightly to