HSBC 2010 Annual Report Download - page 68
Download and view the complete annual report
Please find page 68 of the 2010 HSBC annual report below. You can navigate through the pages in the report by either clicking on the pages listed below, or by using the keyword search tool below to find specific information within the annual report.-
 1
1 -
2
-
3
-
4
-
5
-
6
-
7
-
8
-
9
-
10
-
11
-
12
-
13
-
14
-
15
-
16
-
17
-
18
-
19
-
20
-
21
-
22
-
23
-
24
-
25
-
26
-
27
-
28
-
29
-
30
-
31
-
32
-
33
-
34
-
35
-
36
-
37
-
38
-
39
-
40
-
41
-
42
-
43
-
44
-
45
-
46
-
47
-
48
-
49
-
50
-
51
-
52
-
53
-
54
-
55
-
56
-
57
-
 58
58 -
 59
59 -
 60
60 -
 61
61 -
 62
62 -
 63
63 -
 64
64 -
 65
65 -
 66
66 -
 67
67 -
 68
68 -
 69
69 -
 70
70 -
 71
71 -
 72
72 -
 73
73 -
 74
74 -
 75
75 -
 76
76 -
 77
77 -
 78
78 -
79
-
80
-
81
-
82
-
83
-
84
-
85
-
86
-
87
-
88
-
89
-
90
-
91
-
92
-
93
-
94
-
95
-
96
-
97
-
98
-
99
-
100
-
101
-
102
-
103
-
104
-
105
-
106
-
107
-
108
-
109
-
110
-
111
-
112
-
113
-
114
-
115
-
116
-
117
-
118
-
119
-
120
-
121
-
122
-
123
-
124
-
125
-
126
-
127
-
128
-
129
-
130
-
131
-
132
-
133
-
134
-
135
-
136
-
137
-
138
-
139
-
140
-
141
-
142
-
143
-
144
-
145
-
146
-
147
-
148
-
149
-
150
-
151
-
152
-
153
-
154
-
155
-
156
-
157
-
158
-
159
-
160
-
161
-
162
-
163
-
164
-
165
-
166
-
167
-
168
-
169
-
170
-
171
-
172
-
173
-
174
-
175
-
176
-
177
-
178
-
179
-
180
-
181
-
182
-
183
-
184
-
185
-
186
-
187
-
188
-
189
-
190
-
191
-
192
-
193
-
194
-
195
-
196
-
197
-
198
-
199
-
200
-
201
-
202
-
203
-
204
-
205
-
206
-
207
-
208
-
209
-
210
-
211
-
212
-
213
-
214
-
215
-
216
-
217
-
218
-
219
-
220
-
221
-
222
-
223
-
224
-
225
-
226
-
227
-
228
-
229
-
230
-
231
-
232
-
233
-
234
-
235
-
236
-
237
-
238
-
239
-
240
-
241
-
242
-
243
-
244
-
245
-
246
-
247
-
248
-
249
-
250
-
251
-
252
-
253
-
254
-
255
-
256
-
257
-
258
-
259
-
260
-
261
-
262
-
263
-
264
-
265
-
266
-
267
-
268
-
269
-
270
-
271
-
272
-
273
-
274
-
275
-
276
-
277
-
278
-
279
-
280
-
281
-
282
-
283
-
284
-
285
-
286
-
287
-
288
-
289
-
290
-
291
-
292
-
293
-
294
-
295
-
296
-
297
-
298
-
299
-
300
-
301
-
302
-
303
-
304
-
305
-
306
-
307
-
308
-
309
-
310
-
311
-
312
-
313
-
314
-
315
-
316
-
317
-
318
-
319
-
320
-
321
-
322
-
323
-
324
-
325
-
326
-
327
-
328
-
329
-
330
-
331
-
332
-
333
-
334
-
335
-
336
-
337
-
338
-
339
-
340
-
341
-
342
-
343
-
344
-
345
-
346
-
347
-
348
-
349
-
350
-
351
-
352
-
353
-
354
-
355
-
356
-
357
-
358
-
359
-
360
-
361
-
362
-
363
-
364
-
365
-
366
-
367
-
368
-
369
-
370
-
371
-
372
-
373
-
374
-
375
-
376
-
377
-
378
-
379
-
380
-
381
-
382
-
383
-
384
-
385
-
386
-
387
-
388
-
389
-
390
-
391
-
392
-
393
-
394
-
395
-
396
 |
 |

HSBC HOLDINGS PLC
Report of the Directors: Operating and Financial Review (continued)
Geographical regions > Middle East
66
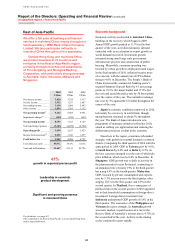
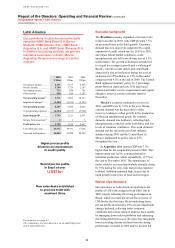
Middle East
In the Middle East, the network of branches of
HSBC Bank Middle East Limited, together with
HSBC’s subsidiaries and associates, gives us
the widest coverage in the region. Our
associate in Saudi Arabia, The Saudi British
Bank (40% owned), is the Kingdom’s fifth
largest bank by total assets.
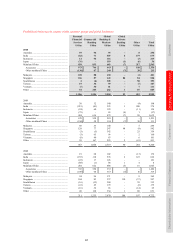
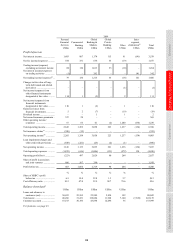
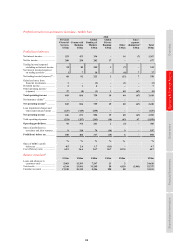
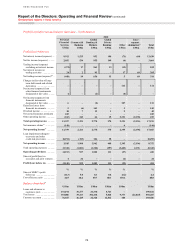
2010 2009 2008
US$m US$m US$m
Net interest income ........... 1,367 1,485 1,556
Net fee income .................. 677 625 691
Net trading income ........... 370 394 402
Other income .................... (4) 90 19
Net operating income46 ... 2,410 2,594 2,668
Impairment charges47 ........ (627) (1,334) (279)
Net operating income ..... 1,783 1,260 2,389
Total operating expenses .. (1,078) (1,001) (959)
Operating profit .............. 705 259 1,430
Income from associates48 .. 187 196 316
Profit before tax .............. 892 455 1,746
Cost efficiency ratio ......... 44.7% 38.6% 35.9%
Year-end staff numbers .... 8,676 8,281 8,453
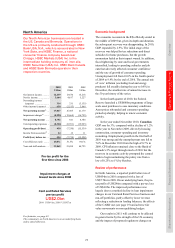
Underlying pre-tax
profit doubled
Leading provider of
traditional trade services
in the UAE
PFS in the Middle East
returns to profitability
For footnotes, see page 83.
The commentary on the Middle East is on an underlying basis
unless stated otherwise.
Economic background
Economic activity in much of the Middle East
showed signs of stabilising during 2010. A 30% year
on year rise in average oil prices led to a marked
strengthening of public finances in the Gulf states,
allowing governments such as Saudi Arabia to
boost public current and capital spending. The high
and stable average oil prices also improved external
account positions in the Gulf, leading to an increase
in reserves and overall net foreign asset accumulation
following the modest drawdowns in 2009.
As well as receiving support from rising public
spending, non-oil goods and service exporters in the
region also benefited from rising external demand,
particularly from Asia. The UAE was a leading
beneficiary, most notably in its transport and
logistics sectors. Banking sector activity remained
relatively subdued, with rates of credit growth flat
or negative in real terms across much of the region.
This contributed to subdued consumer and asset
price inflation. Although there was some evidence
in Saudi Arabia, Oman and Kuwait that stronger
growth and higher commodity prices were putting
pressure on prices in late 2010, the pace of increase
remained below that seen in other emerging markets.
Inflation was largely absent in the UAE.
Dubai had another challenging year in 2010, as
it continued to struggle with high levels of debt,
falling real estate prices and a stagnant credit market.
Although no figures have been released, officials
estimated in October that real GDP was likely to
have grown by 2.3% in 2010, mostly from global
trade as exports rose 35% in the year to the third
quarter. The domestic economy was considerably
weaker through most of the year although there were
signs of an improvement by the year end.
In Egypt, GDP growth returned to 6% by the
end of 2010, driven primarily by domestic demand.
Egypt’s structural economic strengths leave us
positive on the medium-term outlook, although
recent political turmoil might overshadow its near-
term prospects.
Review of performance
Our operations in the Middle East reported pre-tax
profits of US$892m, an increase of US$437m
compared with 2009.
In October 2010, we completed the sale of our
investment in the British Arab Commercial Bank,
on which a loss of US$42m was recorded. On an
underlying basis and excluding this loss, pre-tax
profits increased by US$481m.