HSBC 2010 Annual Report Download - page 149
Download and view the complete annual report
Please find page 149 of the 2010 HSBC annual report below. You can navigate through the pages in the report by either clicking on the pages listed below, or by using the keyword search tool below to find specific information within the annual report.-
 1
1 -
2
-
3
-
4
-
5
-
6
-
7
-
8
-
9
-
10
-
11
-
12
-
13
-
14
-
15
-
16
-
17
-
18
-
19
-
20
-
21
-
22
-
23
-
24
-
25
-
26
-
27
-
28
-
29
-
30
-
31
-
32
-
33
-
34
-
35
-
36
-
37
-
38
-
39
-
40
-
41
-
42
-
43
-
44
-
45
-
46
-
47
-
48
-
49
-
50
-
51
-
52
-
53
-
54
-
55
-
56
-
57
-
58
-
59
-
60
-
61
-
62
-
63
-
64
-
65
-
66
-
67
-
68
-
69
-
70
-
71
-
72
-
73
-
74
-
75
-
76
-
77
-
78
-
79
-
80
-
81
-
82
-
83
-
84
-
85
-
86
-
87
-
88
-
89
-
90
-
91
-
92
-
93
-
94
-
95
-
96
-
97
-
98
-
99
-
100
-
101
-
102
-
103
-
104
-
105
-
106
-
107
-
108
-
109
-
110
-
111
-
112
-
113
-
114
-
115
-
116
-
117
-
118
-
119
-
120
-
121
-
122
-
123
-
124
-
125
-
126
-
127
-
128
-
129
-
130
-
131
-
132
-
133
-
134
-
135
-
136
-
137
-
138
-
 139
139 -
 140
140 -
 141
141 -
 142
142 -
 143
143 -
 144
144 -
 145
145 -
 146
146 -
 147
147 -
 148
148 -
 149
149 -
 150
150 -
 151
151 -
 152
152 -
 153
153 -
 154
154 -
 155
155 -
 156
156 -
 157
157 -
 158
158 -
 159
159 -
160
-
161
-
162
-
163
-
164
-
165
-
166
-
167
-
168
-
169
-
170
-
171
-
172
-
173
-
174
-
175
-
176
-
177
-
178
-
179
-
180
-
181
-
182
-
183
-
184
-
185
-
186
-
187
-
188
-
189
-
190
-
191
-
192
-
193
-
194
-
195
-
196
-
197
-
198
-
199
-
200
-
201
-
202
-
203
-
204
-
205
-
206
-
207
-
208
-
209
-
210
-
211
-
212
-
213
-
214
-
215
-
216
-
217
-
218
-
219
-
220
-
221
-
222
-
223
-
224
-
225
-
226
-
227
-
228
-
229
-
230
-
231
-
232
-
233
-
234
-
235
-
236
-
237
-
238
-
239
-
240
-
241
-
242
-
243
-
244
-
245
-
246
-
247
-
248
-
249
-
250
-
251
-
252
-
253
-
254
-
255
-
256
-
257
-
258
-
259
-
260
-
261
-
262
-
263
-
264
-
265
-
266
-
267
-
268
-
269
-
270
-
271
-
272
-
273
-
274
-
275
-
276
-
277
-
278
-
279
-
280
-
281
-
282
-
283
-
284
-
285
-
286
-
287
-
288
-
289
-
290
-
291
-
292
-
293
-
294
-
295
-
296
-
297
-
298
-
299
-
300
-
301
-
302
-
303
-
304
-
305
-
306
-
307
-
308
-
309
-
310
-
311
-
312
-
313
-
314
-
315
-
316
-
317
-
318
-
319
-
320
-
321
-
322
-
323
-
324
-
325
-
326
-
327
-
328
-
329
-
330
-
331
-
332
-
333
-
334
-
335
-
336
-
337
-
338
-
339
-
340
-
341
-
342
-
343
-
344
-
345
-
346
-
347
-
348
-
349
-
350
-
351
-
352
-
353
-
354
-
355
-
356
-
357
-
358
-
359
-
360
-
361
-
362
-
363
-
364
-
365
-
366
-
367
-
368
-
369
-
370
-
371
-
372
-
373
-
374
-
375
-
376
-
377
-
378
-
379
-
380
-
381
-
382
-
383
-
384
-
385
-
386
-
387
-
388
-
389
-
390
-
391
-
392
-
393
-
394
-
395
-
396
 |
 |

147
Overview Operating & Financial Review Governance Financial Statements Shareholder Information
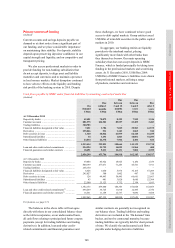
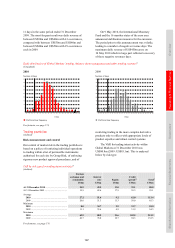
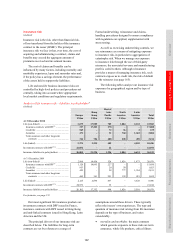
11 days in the same period ended 31 December
2009. The most frequent result was daily revenue of
between US$30m and US$40m with 41 occurrences,
compared with between US$30m and US$40m and
between US$40m and US$50m with 29 occurrences
each in 2009.
On 9 May 2010, the International Monetary
Fund and the 16 member states of the euro area
announced stabilisation measures for the eurozone.
The period prior to this announcement was volatile,
leading to a number of negative revenue days. The
maximum daily revenue of US$450m arose on
10 May 2010 which in large part reflected a recovery
of these negative revenues days.
Daily distribution of Global Markets’ trading, balance sheet management and other trading revenues67
(Unaudited)
2010
Number of days
2009
Number of days
44
1
323
6
12
17
32
37
40
41
23
1515
2
3
0
5
10
15
20
25
30
35
40
45
- 30 - 20 -10 0 10 20 30 40 50 60 70 80 90 100 110 120 130 140 440 450
2
29
26
9
22
0
15
28
19
1
00
3
6
10
32
4
8
17 18
29
8
0
5
10
15
20
25
30
35
40
45
-40-30-20-100 102030405060708090100110120130140150160170180190
US$m US$m
Profit and loss frequency Profit and loss frequency
For footnote, see page 174.
Trading portfolios
(Audited)
Risk measurement and control
Our control of market risk in the trading portfolios is
based on a policy of restricting individual operations
to trading within a list of permissible instruments
authorised for each site by Group Risk, of enforcing
rigorous new product approval procedures, and of
restricting trading in the more complex derivative
products only to offices with appropriate levels of
product expertise and robust control systems.
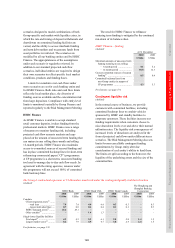
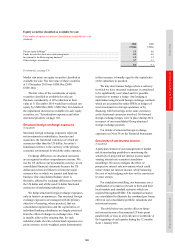
The VAR for trading intent activity within
Global Markets at 31 December 2010 was
US$80.8m (2009: US$95.1m). This is analysed
below by risk type:
VAR by risk type for trading intent activities68
(Audited)
Foreign
exchange and
commodity
Interest
rate
Equity
Credit
spread69
Total70
US$m US$m US$m US$m US$m
At 31 December 2010 ..................................... 24.9 49.5 13.0 39.1 80.8
At 31 December 2009 ...................................... 19.5 42.6 17.5 59.3 95.1
Average
2010 ............................................................. 27.2 51.6 9.2 62.0 113.4
2009 ............................................................. 20.6 51.3 11.3 58.0 85.3
Minimum
2010 ............................................................. 8.0 34.7 2.9 33.7 55.0
2009 ............................................................. 11.1 35.6 4.9 31.9 54.3
Maximum
2010 ............................................................. 62.9 88.9 21.6 102.5 212.2
2009 ............................................................. 46.7 78.0 18.7 94.3 132.5
For footnotes, see page 174.