HSBC 2010 Annual Report Download - page 330
Download and view the complete annual report
Please find page 330 of the 2010 HSBC annual report below. You can navigate through the pages in the report by either clicking on the pages listed below, or by using the keyword search tool below to find specific information within the annual report.-
 1
1 -
2
-
3
-
4
-
5
-
6
-
7
-
8
-
9
-
10
-
11
-
12
-
13
-
14
-
15
-
16
-
17
-
18
-
19
-
20
-
21
-
22
-
23
-
24
-
25
-
26
-
27
-
28
-
29
-
30
-
31
-
32
-
33
-
34
-
35
-
36
-
37
-
38
-
39
-
40
-
41
-
42
-
43
-
44
-
45
-
46
-
47
-
48
-
49
-
50
-
51
-
52
-
53
-
54
-
55
-
56
-
57
-
58
-
59
-
60
-
61
-
62
-
63
-
64
-
65
-
66
-
67
-
68
-
69
-
70
-
71
-
72
-
73
-
74
-
75
-
76
-
77
-
78
-
79
-
80
-
81
-
82
-
83
-
84
-
85
-
86
-
87
-
88
-
89
-
90
-
91
-
92
-
93
-
94
-
95
-
96
-
97
-
98
-
99
-
100
-
101
-
102
-
103
-
104
-
105
-
106
-
107
-
108
-
109
-
110
-
111
-
112
-
113
-
114
-
115
-
116
-
117
-
118
-
119
-
120
-
121
-
122
-
123
-
124
-
125
-
126
-
127
-
128
-
129
-
130
-
131
-
132
-
133
-
134
-
135
-
136
-
137
-
138
-
139
-
140
-
141
-
142
-
143
-
144
-
145
-
146
-
147
-
148
-
149
-
150
-
151
-
152
-
153
-
154
-
155
-
156
-
157
-
158
-
159
-
160
-
161
-
162
-
163
-
164
-
165
-
166
-
167
-
168
-
169
-
170
-
171
-
172
-
173
-
174
-
175
-
176
-
177
-
178
-
179
-
180
-
181
-
182
-
183
-
184
-
185
-
186
-
187
-
188
-
189
-
190
-
191
-
192
-
193
-
194
-
195
-
196
-
197
-
198
-
199
-
200
-
201
-
202
-
203
-
204
-
205
-
206
-
207
-
208
-
209
-
210
-
211
-
212
-
213
-
214
-
215
-
216
-
217
-
218
-
219
-
220
-
221
-
222
-
223
-
224
-
225
-
226
-
227
-
228
-
229
-
230
-
231
-
232
-
233
-
234
-
235
-
236
-
237
-
238
-
239
-
240
-
241
-
242
-
243
-
244
-
245
-
246
-
247
-
248
-
249
-
250
-
251
-
252
-
253
-
254
-
255
-
256
-
257
-
258
-
259
-
260
-
261
-
262
-
263
-
264
-
265
-
266
-
267
-
268
-
269
-
270
-
271
-
272
-
273
-
274
-
275
-
276
-
277
-
278
-
279
-
280
-
281
-
282
-
283
-
284
-
285
-
286
-
287
-
288
-
289
-
290
-
291
-
292
-
293
-
294
-
295
-
296
-
297
-
298
-
299
-
300
-
301
-
302
-
303
-
304
-
305
-
306
-
307
-
308
-
309
-
310
-
311
-
312
-
313
-
314
-
315
-
316
-
317
-
318
-
319
-
 320
320 -
 321
321 -
 322
322 -
 323
323 -
 324
324 -
 325
325 -
 326
326 -
 327
327 -
 328
328 -
 329
329 -
 330
330 -
 331
331 -
 332
332 -
 333
333 -
 334
334 -
 335
335 -
 336
336 -
 337
337 -
 338
338 -
 339
339 -
 340
340 -
341
-
342
-
343
-
344
-
345
-
346
-
347
-
348
-
349
-
350
-
351
-
352
-
353
-
354
-
355
-
356
-
357
-
358
-
359
-
360
-
361
-
362
-
363
-
364
-
365
-
366
-
367
-
368
-
369
-
370
-
371
-
372
-
373
-
374
-
375
-
376
-
377
-
378
-
379
-
380
-
381
-
382
-
383
-
384
-
385
-
386
-
387
-
388
-
389
-
390
-
391
-
392
-
393
-
394
-
395
-
396
 |
 |

HSBC HOLDINGS PLC
Notes on the Financial Statements (continued)
21 – Financial investments / 22 – Transfers of financial assets not qualifying for derecognition
328
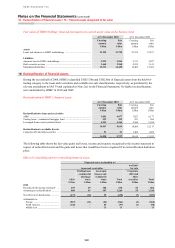
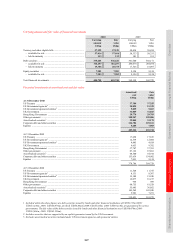
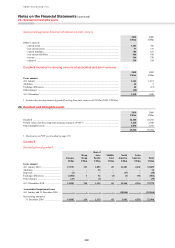
Financial investments listed on a recognised exchange and unlisted
Treasury
and other
eligible bills
available
for sale
Treasury
and other
eligible bills
held to
maturity
Debt
securities
available
for sale
Debt
securities
held to
maturity
Equity
securities
available
for sale
Total
US$m US$m US$m US$m US$m US$m
Carrying amount at 31 December 2010
Listed on a recognised exchange1 ...................... 1,400 – 138,374 4,182 851 144,807
Unlisted2 ............................................................. 55,616 113 177,883 15,204 7,132 255,948
57,016 113 316,257 19,386 7,983 400,755
Carrying amount at 31 December 2009
Listed on a recognised exchange1 ...................... 2,334 – 135,653 2,743 911 141,641
Unlisted2 ............................................................. 55,999 101 148,421 14,783 8,213 227,517
58,333 101 284,074 17,526 9,124 369,158
1 The fair value of listed held-to-maturity debt securities as at 31 December 2010 was US$4,332m (2009: US$2,769m). Included within
listed investments were US$1,902m (2009: US$1,670m) of investments listed in Hong Kong.
2 Unlisted treasury and other eligible bills available for sale primarily comprise treasury bills not listed on a recognised exchange but for
which there is a liquid market.
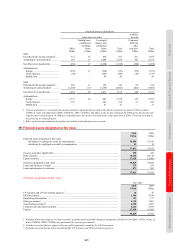
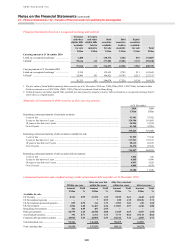
Maturities of investments in debt securities at their carrying amount
At 31 December
2010 2009
US$m US$m
Remaining contractual maturity of total debt securities:
1 year or less ......................................................................................................................................... 92,961 75,782
5 years or less but over 1 year .............................................................................................................. 124,596 141,683
10 years or less but over 5 years .......................................................................................................... 56,926 31,934
Over 10 years ........................................................................................................................................ 61,160 52,201
335,643 301,600
Remaining contractual maturity of debt securities available for sale:
1 year or less ......................................................................................................................................... 91,939 75,160
5 years or less but over 1 year .............................................................................................................. 117,931 135,187
10 years or less but over 5 years .......................................................................................................... 50,113 26,105
Over 10 years ........................................................................................................................................ 56,274 47,622
316,257 284,074
Remaining contractual maturity of debt securities held to maturity:
1 year or less ......................................................................................................................................... 1,022 622
5 years or less but over 1 year .............................................................................................................. 6,665 6,496
10 years or less but over 5 years .......................................................................................................... 6,813 5,829
Over 10 years ........................................................................................................................................ 4,886 4,579
19,386 17,526
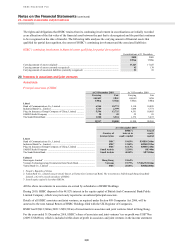
Contractual maturities and weighted average yields of investment debt securities at 31 December 2010
Within one year
After one year but
within five years
After five years but
within ten years After ten years
Amount Yield Amount Yield Amount Yield Amount Yield
US$m % US$m % US$m % US$m %
Available-for-sale
US Treasury ............................................. 8,761 0.95 13,513 1.19 9,225 2.61 4,648 4.32
US Government agencies ........................ – – 7 2.95 230 4.78 20,236 3.71
US Government-sponsored agencies ....... 859 0.70 114 1.75 1,993 3.81 445 3.60
UK Government ....................................... 3,994 2.90 11,407 2.22 13,987 2.97 1,248 2.80
Hong Kong Government ......................... 362 0.55 407 2.95 – – – –
Other governments .................................. 28,779 2.25 44,920 4.00 6,945 4.65 2,073 4.58
Asset-backed securities ........................... 392 0.77 2,311 1.73 7,773 0.66 29,178 0.64
Corporate debt and other securities ......... 49,014 2.26 44,009 2.54 10,342 3.44 4,065 4.72
Total amortised cost ................................. 92,161 116,688 50,495 61,893
Total carrying value ................................. 91,939 117,931 50,113 56,274