HSBC 2010 Annual Report Download - page 243
Download and view the complete annual report
Please find page 243 of the 2010 HSBC annual report below. You can navigate through the pages in the report by either clicking on the pages listed below, or by using the keyword search tool below to find specific information within the annual report.-
 1
1 -
2
-
3
-
4
-
5
-
6
-
7
-
8
-
9
-
10
-
11
-
12
-
13
-
14
-
15
-
16
-
17
-
18
-
19
-
20
-
21
-
22
-
23
-
24
-
25
-
26
-
27
-
28
-
29
-
30
-
31
-
32
-
33
-
34
-
35
-
36
-
37
-
38
-
39
-
40
-
41
-
42
-
43
-
44
-
45
-
46
-
47
-
48
-
49
-
50
-
51
-
52
-
53
-
54
-
55
-
56
-
57
-
58
-
59
-
60
-
61
-
62
-
63
-
64
-
65
-
66
-
67
-
68
-
69
-
70
-
71
-
72
-
73
-
74
-
75
-
76
-
77
-
78
-
79
-
80
-
81
-
82
-
83
-
84
-
85
-
86
-
87
-
88
-
89
-
90
-
91
-
92
-
93
-
94
-
95
-
96
-
97
-
98
-
99
-
100
-
101
-
102
-
103
-
104
-
105
-
106
-
107
-
108
-
109
-
110
-
111
-
112
-
113
-
114
-
115
-
116
-
117
-
118
-
119
-
120
-
121
-
122
-
123
-
124
-
125
-
126
-
127
-
128
-
129
-
130
-
131
-
132
-
133
-
134
-
135
-
136
-
137
-
138
-
139
-
140
-
141
-
142
-
143
-
144
-
145
-
146
-
147
-
148
-
149
-
150
-
151
-
152
-
153
-
154
-
155
-
156
-
157
-
158
-
159
-
160
-
161
-
162
-
163
-
164
-
165
-
166
-
167
-
168
-
169
-
170
-
171
-
172
-
173
-
174
-
175
-
176
-
177
-
178
-
179
-
180
-
181
-
182
-
183
-
184
-
185
-
186
-
187
-
188
-
189
-
190
-
191
-
192
-
193
-
194
-
195
-
196
-
197
-
198
-
199
-
200
-
201
-
202
-
203
-
204
-
205
-
206
-
207
-
208
-
209
-
210
-
211
-
212
-
213
-
214
-
215
-
216
-
217
-
218
-
219
-
220
-
221
-
222
-
223
-
224
-
225
-
226
-
227
-
228
-
229
-
230
-
231
-
232
-
 233
233 -
 234
234 -
 235
235 -
 236
236 -
 237
237 -
 238
238 -
 239
239 -
 240
240 -
 241
241 -
 242
242 -
 243
243 -
 244
244 -
 245
245 -
 246
246 -
 247
247 -
 248
248 -
 249
249 -
 250
250 -
 251
251 -
 252
252 -
 253
253 -
254
-
255
-
256
-
257
-
258
-
259
-
260
-
261
-
262
-
263
-
264
-
265
-
266
-
267
-
268
-
269
-
270
-
271
-
272
-
273
-
274
-
275
-
276
-
277
-
278
-
279
-
280
-
281
-
282
-
283
-
284
-
285
-
286
-
287
-
288
-
289
-
290
-
291
-
292
-
293
-
294
-
295
-
296
-
297
-
298
-
299
-
300
-
301
-
302
-
303
-
304
-
305
-
306
-
307
-
308
-
309
-
310
-
311
-
312
-
313
-
314
-
315
-
316
-
317
-
318
-
319
-
320
-
321
-
322
-
323
-
324
-
325
-
326
-
327
-
328
-
329
-
330
-
331
-
332
-
333
-
334
-
335
-
336
-
337
-
338
-
339
-
340
-
341
-
342
-
343
-
344
-
345
-
346
-
347
-
348
-
349
-
350
-
351
-
352
-
353
-
354
-
355
-
356
-
357
-
358
-
359
-
360
-
361
-
362
-
363
-
364
-
365
-
366
-
367
-
368
-
369
-
370
-
371
-
372
-
373
-
374
-
375
-
376
-
377
-
378
-
379
-
380
-
381
-
382
-
383
-
384
-
385
-
386
-
387
-
388
-
389
-
390
-
391
-
392
-
393
-
394
-
395
-
396
 |
 |

241
Overview Operating & Financial Review Governance Financial Statements Shareholder Information
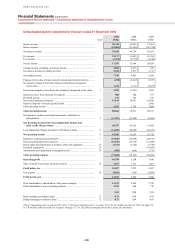
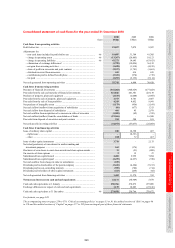
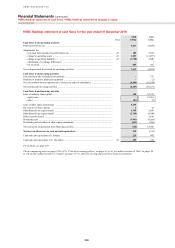
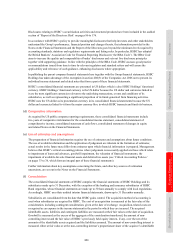
Consolidated statement of cash flows for the year ended 31 December 2010
2010 2009 2008
Notes US$m US$m US$m
Cash flows from operating activities
Profit before tax ............................................................................................... 19,037 7,079 9,307
Adjustments for:
– non-cash items included in profit before tax ........................................... 40 18,887 31,384 41,305
– change in operating assets ........................................................................ 40 (13,267) (20,803) 18,123
– change in operating liabilities .................................................................. 40 42,272 14,645 (63,413)
– elimination of exchange differences1 ....................................................... (1,799) (19,024) 36,132
– net gain from investing activities ............................................................. (1,698) (1,910) (4,195)
– share of profits in associates and joint ventures ...................................... (2,517) (1,781) (1,661)
– dividends received from associates .......................................................... 441 414 655
– contributions paid to defined benefit plans .............................................. (3,321) (974) (719)
– tax paid ..................................................................................................... (2,293) (2,132) (5,114)
Net cash generated from operating activities .................................................. 55,742 6,898 30,420
Cash flows from investing activities
Purchase of financial investments ................................................................... (341,202) (304,629) (277,023)
Proceeds from the sale and maturity of financial investments ....................... 321,846 241,341 223,138
Purchase of property, plant and equipment ..................................................... (2,533) (2,000) (2,985)
Proceeds from the sale of property, plant and equipment ............................... 4,373 4,701 2,467
Proceeds from the sale of loan portfolios ........................................................ 4,243 4,852 9,941
Net purchase of intangible assets .................................................................... (1,179) (956) (1,169)
Net cash inflow/(outflow) from acquisition of subsidiaries ........................... (86) (677) 1,313
Net cash inflow from disposal of subsidiaries ................................................ 466 45 2,979
Net cash outflow from acquisition of or increase in stake of associates ........ (1,589) (62) (355)
Net cash inflow/(outflow) from the consolidation of funds ............................ (19,566) – 16,500
Proceeds from disposal of associates and joint ventures ................................ 254 308 101
Net cash used in investing activities ............................................................... (34,973) (57,077) (25,093)
Cash flows from financing activities
Issue of ordinary share capital ......................................................................... 180 18,398 467
– rights issue ................................................................................................ – 18,326 –
– other .......................................................................................................... 180 72 467
Issue of other equity instruments .................................................................... 3,718 – 2,133
Net sales/(purchases) of own shares for market-making and
investment purposes .................................................................................... 163 (176) (194)
Purchases of own shares to meet share awards and share option awards ....... 11 (51) (808)
On exercise of share options ........................................................................... 2 12 27
Subordinated loan capital issued ..................................................................... 4,481 2,959 7,094
Subordinated loan capital repaid ..................................................................... (2,475) (4,637) (350)
Net cash outflow from change in stake in subsidiaries ................................... (229) – –
Dividends paid to shareholders of the parent company .................................. (3,441) (4,264) (7,211)
Dividends paid to non-controlling interests .................................................... (595) (702) (714)
Dividends paid to holders of other equity instruments ................................... (413) (269) (92)
Net cash generated from financing activities .................................................. 1,402 11,270 352
Net increase/(decrease) in cash and cash equivalents ................................ 22,171 (38,909) 5,679
Cash and cash equivalents at 1 January .......................................................... 250,766 278,872 297,009
Exchange differences in respect of cash and cash equivalents ....................... 1,139 10,803 (23,816)
Cash and cash equivalents at 31 December .................................................... 40 274,076 250,766 278,872
For footnote, see page 249.
The accompanying notes on pages 250 to 370, ‘Critical accounting policies’ on pages 33 to 36, the audited sections of ‘Risk’ on pages 86
to 176 and the audited sections of ‘Capital’ on pages 177 to 182 form an integral part of these financial statements.