HSBC 2010 Annual Report Download - page 42
Download and view the complete annual report
Please find page 42 of the 2010 HSBC annual report below. You can navigate through the pages in the report by either clicking on the pages listed below, or by using the keyword search tool below to find specific information within the annual report.-
 1
1 -
2
-
3
-
4
-
5
-
6
-
7
-
8
-
9
-
10
-
11
-
12
-
13
-
14
-
15
-
16
-
17
-
18
-
19
-
20
-
21
-
22
-
23
-
24
-
25
-
26
-
27
-
28
-
29
-
30
-
31
-
 32
32 -
 33
33 -
 34
34 -
 35
35 -
 36
36 -
 37
37 -
 38
38 -
 39
39 -
 40
40 -
 41
41 -
 42
42 -
 43
43 -
 44
44 -
 45
45 -
 46
46 -
 47
47 -
 48
48 -
 49
49 -
 50
50 -
 51
51 -
 52
52 -
53
-
54
-
55
-
56
-
57
-
58
-
59
-
60
-
61
-
62
-
63
-
64
-
65
-
66
-
67
-
68
-
69
-
70
-
71
-
72
-
73
-
74
-
75
-
76
-
77
-
78
-
79
-
80
-
81
-
82
-
83
-
84
-
85
-
86
-
87
-
88
-
89
-
90
-
91
-
92
-
93
-
94
-
95
-
96
-
97
-
98
-
99
-
100
-
101
-
102
-
103
-
104
-
105
-
106
-
107
-
108
-
109
-
110
-
111
-
112
-
113
-
114
-
115
-
116
-
117
-
118
-
119
-
120
-
121
-
122
-
123
-
124
-
125
-
126
-
127
-
128
-
129
-
130
-
131
-
132
-
133
-
134
-
135
-
136
-
137
-
138
-
139
-
140
-
141
-
142
-
143
-
144
-
145
-
146
-
147
-
148
-
149
-
150
-
151
-
152
-
153
-
154
-
155
-
156
-
157
-
158
-
159
-
160
-
161
-
162
-
163
-
164
-
165
-
166
-
167
-
168
-
169
-
170
-
171
-
172
-
173
-
174
-
175
-
176
-
177
-
178
-
179
-
180
-
181
-
182
-
183
-
184
-
185
-
186
-
187
-
188
-
189
-
190
-
191
-
192
-
193
-
194
-
195
-
196
-
197
-
198
-
199
-
200
-
201
-
202
-
203
-
204
-
205
-
206
-
207
-
208
-
209
-
210
-
211
-
212
-
213
-
214
-
215
-
216
-
217
-
218
-
219
-
220
-
221
-
222
-
223
-
224
-
225
-
226
-
227
-
228
-
229
-
230
-
231
-
232
-
233
-
234
-
235
-
236
-
237
-
238
-
239
-
240
-
241
-
242
-
243
-
244
-
245
-
246
-
247
-
248
-
249
-
250
-
251
-
252
-
253
-
254
-
255
-
256
-
257
-
258
-
259
-
260
-
261
-
262
-
263
-
264
-
265
-
266
-
267
-
268
-
269
-
270
-
271
-
272
-
273
-
274
-
275
-
276
-
277
-
278
-
279
-
280
-
281
-
282
-
283
-
284
-
285
-
286
-
287
-
288
-
289
-
290
-
291
-
292
-
293
-
294
-
295
-
296
-
297
-
298
-
299
-
300
-
301
-
302
-
303
-
304
-
305
-
306
-
307
-
308
-
309
-
310
-
311
-
312
-
313
-
314
-
315
-
316
-
317
-
318
-
319
-
320
-
321
-
322
-
323
-
324
-
325
-
326
-
327
-
328
-
329
-
330
-
331
-
332
-
333
-
334
-
335
-
336
-
337
-
338
-
339
-
340
-
341
-
342
-
343
-
344
-
345
-
346
-
347
-
348
-
349
-
350
-
351
-
352
-
353
-
354
-
355
-
356
-
357
-
358
-
359
-
360
-
361
-
362
-
363
-
364
-
365
-
366
-
367
-
368
-
369
-
370
-
371
-
372
-
373
-
374
-
375
-
376
-
377
-
378
-
379
-
380
-
381
-
382
-
383
-
384
-
385
-
386
-
387
-
388
-
389
-
390
-
391
-
392
-
393
-
394
-
395
-
396
 |
 |

HSBC HOLDINGS PLC
Report of the Directors: Operating and Financial Review (continued)
Customer groups and global businesses > PFS
40
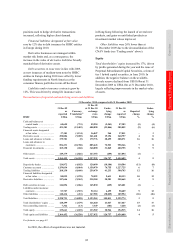
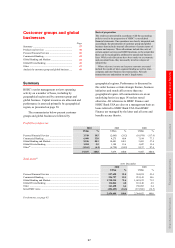
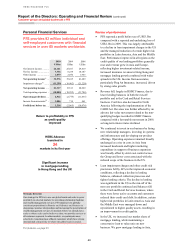
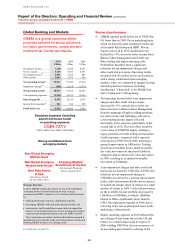
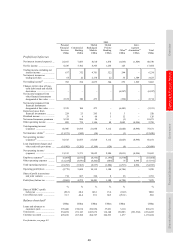
Personal Financial Services
PFS provides 92 million individual and
self-employed customers with financial
services in over 60 markets worldwide.
2010 2009 2008
US$m US$m US$m
Net interest income ........... 24,161 25,107 29,419
Net fee income .................. 7,336 8,238 10,107
Other income .................... 1,079 2,070 1,963
Net operating income46 ... 32,576 35,415 41,489
Impairment charges47 ........ (11,259) (19,902) (21,220)
Net operating income ..... 21,317 15,513 20,269
Total operating expenses .. (18,805) (18,292) (31,704)
Operating profit/(loss) .... 2,512 (2,779) (11,435)
Income from associates48 .. 1,006 714 461
Profit/(loss) before tax .... 3,518 (2,065) (10,974)
Return to profitability in PFS
as credit quality
improved
HSBC Advance
launched in
34
markets in its first year
Significant increase
in mortgage lending
in Hong Kong and the UK
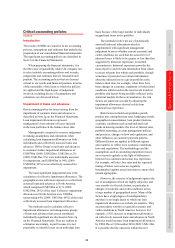
Strategic direction
Our strategy for PFS is to use our global reach and scale to grow
profitably in selected markets by providing relationship banking
and wealth management services. PFS employs two globally
consistent propositions in Premier and Advance and focuses on
deepening customer relationships and increasing the penetration of
wealth management services. In markets where we already have
scale or where scale can be built over time, we provide services to
all customer segments. In other markets, we participate more
selectively, targeting mass affluent customers which have strong
international connectivity or where our global scale is crucial.
For footnotes, see page 83.
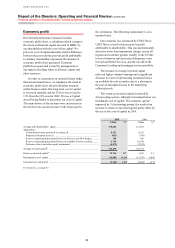
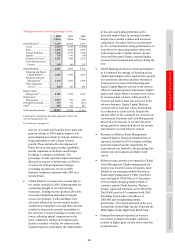
Review of performance
• PFS reported a profit before tax of US$3.5bn
compared with a reported and underlying loss of
US$2.1bn in 2009. This was largely attributable
to a decline in loan impairment charges in the US
and the managed reduction of certain higher risk
portfolios in Latin America, Asia and the Middle
East. Performance improved in all regions as the
credit quality of our lending portfolios generally
rose and revenue grew in Asia and Europe,
reflecting higher investment-related income,
increased insurance revenue in Hong Kong and
mortgage lending growth combined with wider
spreads in the UK. Income from associates,
particularly Ping An Insurance, increased, driven
by strong sales growth.
• Revenue fell, largely in HSBC Finance, due to
lower lending balances in both the run-off
portfolio and in the Card and Retail Services
business. Card fees also decreased in North
America following the implementation of the
CARD Act. Revenue was further affected by an
adverse fair value movement related to the non-
qualifying hedges recorded in HSBC Finance
compared with a favourable movement in 2009,
as long-term interest rates declined.
• We continued to invest in our business by hiring
new relationship managers, investing in systems
and infrastructure and developing our product
offerings. Operating expenses remained broadly
unchanged as a rise in costs in Asia from
increased headcount and higher marketing
expenditure in support of business expansion
was broadly offset by strict cost control across
the Group and lower costs associated with the
reduced scope of the business in the US.
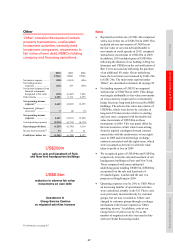
• Loan impairment charges and other credit risk
provisions fell by 44% in the improved economic
conditions, reflecting a decline in lending
balances, enhanced collection processes and
tighter lending criteria. The decline in lending
was significant in the US as the run-off of the
non-core portfolio continued and balances fell
in the Card and Retail Services business, where
there were fewer active accounts and customers
reduced their credit card debt. In addition, certain
higher risk portfolios in Latin America, Asia and
the Middle East were managed down and
repositioned to higher quality assets, resulting in
an improvement in credit quality.
• In the UK, we increased our market share of
mortgage lending, while maintaining a
conservative loan to value ratio on new
business. We grew mortgage lending in Asia,