HSBC 2010 Annual Report Download - page 65
Download and view the complete annual report
Please find page 65 of the 2010 HSBC annual report below. You can navigate through the pages in the report by either clicking on the pages listed below, or by using the keyword search tool below to find specific information within the annual report.-
 1
1 -
2
-
3
-
4
-
5
-
6
-
7
-
8
-
9
-
10
-
11
-
12
-
13
-
14
-
15
-
16
-
17
-
18
-
19
-
20
-
21
-
22
-
23
-
24
-
25
-
26
-
27
-
28
-
29
-
30
-
31
-
32
-
33
-
34
-
35
-
36
-
37
-
38
-
39
-
40
-
41
-
42
-
43
-
44
-
45
-
46
-
47
-
48
-
49
-
50
-
51
-
52
-
53
-
54
-
 55
55 -
 56
56 -
 57
57 -
 58
58 -
 59
59 -
 60
60 -
 61
61 -
 62
62 -
 63
63 -
 64
64 -
 65
65 -
 66
66 -
 67
67 -
 68
68 -
 69
69 -
 70
70 -
 71
71 -
 72
72 -
 73
73 -
 74
74 -
 75
75 -
76
-
77
-
78
-
79
-
80
-
81
-
82
-
83
-
84
-
85
-
86
-
87
-
88
-
89
-
90
-
91
-
92
-
93
-
94
-
95
-
96
-
97
-
98
-
99
-
100
-
101
-
102
-
103
-
104
-
105
-
106
-
107
-
108
-
109
-
110
-
111
-
112
-
113
-
114
-
115
-
116
-
117
-
118
-
119
-
120
-
121
-
122
-
123
-
124
-
125
-
126
-
127
-
128
-
129
-
130
-
131
-
132
-
133
-
134
-
135
-
136
-
137
-
138
-
139
-
140
-
141
-
142
-
143
-
144
-
145
-
146
-
147
-
148
-
149
-
150
-
151
-
152
-
153
-
154
-
155
-
156
-
157
-
158
-
159
-
160
-
161
-
162
-
163
-
164
-
165
-
166
-
167
-
168
-
169
-
170
-
171
-
172
-
173
-
174
-
175
-
176
-
177
-
178
-
179
-
180
-
181
-
182
-
183
-
184
-
185
-
186
-
187
-
188
-
189
-
190
-
191
-
192
-
193
-
194
-
195
-
196
-
197
-
198
-
199
-
200
-
201
-
202
-
203
-
204
-
205
-
206
-
207
-
208
-
209
-
210
-
211
-
212
-
213
-
214
-
215
-
216
-
217
-
218
-
219
-
220
-
221
-
222
-
223
-
224
-
225
-
226
-
227
-
228
-
229
-
230
-
231
-
232
-
233
-
234
-
235
-
236
-
237
-
238
-
239
-
240
-
241
-
242
-
243
-
244
-
245
-
246
-
247
-
248
-
249
-
250
-
251
-
252
-
253
-
254
-
255
-
256
-
257
-
258
-
259
-
260
-
261
-
262
-
263
-
264
-
265
-
266
-
267
-
268
-
269
-
270
-
271
-
272
-
273
-
274
-
275
-
276
-
277
-
278
-
279
-
280
-
281
-
282
-
283
-
284
-
285
-
286
-
287
-
288
-
289
-
290
-
291
-
292
-
293
-
294
-
295
-
296
-
297
-
298
-
299
-
300
-
301
-
302
-
303
-
304
-
305
-
306
-
307
-
308
-
309
-
310
-
311
-
312
-
313
-
314
-
315
-
316
-
317
-
318
-
319
-
320
-
321
-
322
-
323
-
324
-
325
-
326
-
327
-
328
-
329
-
330
-
331
-
332
-
333
-
334
-
335
-
336
-
337
-
338
-
339
-
340
-
341
-
342
-
343
-
344
-
345
-
346
-
347
-
348
-
349
-
350
-
351
-
352
-
353
-
354
-
355
-
356
-
357
-
358
-
359
-
360
-
361
-
362
-
363
-
364
-
365
-
366
-
367
-
368
-
369
-
370
-
371
-
372
-
373
-
374
-
375
-
376
-
377
-
378
-
379
-
380
-
381
-
382
-
383
-
384
-
385
-
386
-
387
-
388
-
389
-
390
-
391
-
392
-
393
-
394
-
395
-
396
 |
 |

63
Overview Operating & Financial Review Governance Financial Statements Shareholder Information
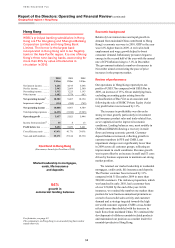
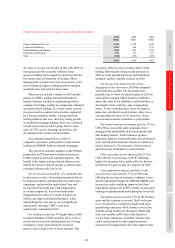
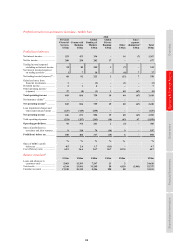
Other operating income increased by 8% to
US$1.4bn, largely due to an increase in PVIF,
reflecting higher life insurance sales in the region
and recoveries against initial fair value on loan
portfolios acquired with Bank Ekonomi in Indonesia
and from The Chinese Bank Co., Ltd in Taiwan.
Net earned insurance premiums increased by
15% to US$448m, largely due to higher sales in
Malaysia, Taiwan and mainland China, primarily
from successful product launches and marketing
campaigns.
Growth in the insurance business resulted in a
related increase in Net insurance claims incurred
and movement in liabilities to policyholders which
was more than offset by the decrease corresponding
to the lower investment gains reported above in ‘Net
income from financial instruments designated at fair
value’.
Loan impairment charges and other credit risk
provisions decreased by 55% to US$439m. As
economic and credit conditions improved across the
region, loan impairment charges fell in PFS, most
notably in India as certain unsecured lending portfolios
were managed down, and fewer specific impairments
were recognised in CMB. Partly offsetting this
improvement were specific impairment charges
booked in GB&M.
Operating expenses increased by 8% to US$5.1bn
in support of business growth and to capitalise on the
region’s economic recovery. Examples were the
continuing expansion of the branch network in
mainland China and the opening of the new
headquarters building in Shanghai, as well as local
incorporation and expansion of the Taiwan operations.
Staff numbers rose to support business expansion,
particularly in the key regional markets of mainland
China, Australia, Singapore and Indonesia. Business
initiatives were supported by marketing campaigns in
most markets and higher transaction volumes which
led to increased processing costs.
Share of profit from associates and joint ventures
in the region increased by 45%, with a higher
contribution from Ping An Insurance driven by strong
sales growth. The share of profit from Bank of
Communications also increased due to growth in
lending and higher fee income from cards, wealth
management and settlement activity. Growth in
lending and an increase in fee income led to a higher
contribution from Industrial Bank.