HSBC 2010 Annual Report Download - page 126
Download and view the complete annual report
Please find page 126 of the 2010 HSBC annual report below. You can navigate through the pages in the report by either clicking on the pages listed below, or by using the keyword search tool below to find specific information within the annual report.-
 1
1 -
2
-
3
-
4
-
5
-
6
-
7
-
8
-
9
-
10
-
11
-
12
-
13
-
14
-
15
-
16
-
17
-
18
-
19
-
20
-
21
-
22
-
23
-
24
-
25
-
26
-
27
-
28
-
29
-
30
-
31
-
32
-
33
-
34
-
35
-
36
-
37
-
38
-
39
-
40
-
41
-
42
-
43
-
44
-
45
-
46
-
47
-
48
-
49
-
50
-
51
-
52
-
53
-
54
-
55
-
56
-
57
-
58
-
59
-
60
-
61
-
62
-
63
-
64
-
65
-
66
-
67
-
68
-
69
-
70
-
71
-
72
-
73
-
74
-
75
-
76
-
77
-
78
-
79
-
80
-
81
-
82
-
83
-
84
-
85
-
86
-
87
-
88
-
89
-
90
-
91
-
92
-
93
-
94
-
95
-
96
-
97
-
98
-
99
-
100
-
101
-
102
-
103
-
104
-
105
-
106
-
107
-
108
-
109
-
110
-
111
-
112
-
113
-
114
-
115
-
 116
116 -
 117
117 -
 118
118 -
 119
119 -
 120
120 -
 121
121 -
 122
122 -
 123
123 -
 124
124 -
 125
125 -
 126
126 -
 127
127 -
 128
128 -
 129
129 -
 130
130 -
 131
131 -
 132
132 -
 133
133 -
 134
134 -
 135
135 -
 136
136 -
137
-
138
-
139
-
140
-
141
-
142
-
143
-
144
-
145
-
146
-
147
-
148
-
149
-
150
-
151
-
152
-
153
-
154
-
155
-
156
-
157
-
158
-
159
-
160
-
161
-
162
-
163
-
164
-
165
-
166
-
167
-
168
-
169
-
170
-
171
-
172
-
173
-
174
-
175
-
176
-
177
-
178
-
179
-
180
-
181
-
182
-
183
-
184
-
185
-
186
-
187
-
188
-
189
-
190
-
191
-
192
-
193
-
194
-
195
-
196
-
197
-
198
-
199
-
200
-
201
-
202
-
203
-
204
-
205
-
206
-
207
-
208
-
209
-
210
-
211
-
212
-
213
-
214
-
215
-
216
-
217
-
218
-
219
-
220
-
221
-
222
-
223
-
224
-
225
-
226
-
227
-
228
-
229
-
230
-
231
-
232
-
233
-
234
-
235
-
236
-
237
-
238
-
239
-
240
-
241
-
242
-
243
-
244
-
245
-
246
-
247
-
248
-
249
-
250
-
251
-
252
-
253
-
254
-
255
-
256
-
257
-
258
-
259
-
260
-
261
-
262
-
263
-
264
-
265
-
266
-
267
-
268
-
269
-
270
-
271
-
272
-
273
-
274
-
275
-
276
-
277
-
278
-
279
-
280
-
281
-
282
-
283
-
284
-
285
-
286
-
287
-
288
-
289
-
290
-
291
-
292
-
293
-
294
-
295
-
296
-
297
-
298
-
299
-
300
-
301
-
302
-
303
-
304
-
305
-
306
-
307
-
308
-
309
-
310
-
311
-
312
-
313
-
314
-
315
-
316
-
317
-
318
-
319
-
320
-
321
-
322
-
323
-
324
-
325
-
326
-
327
-
328
-
329
-
330
-
331
-
332
-
333
-
334
-
335
-
336
-
337
-
338
-
339
-
340
-
341
-
342
-
343
-
344
-
345
-
346
-
347
-
348
-
349
-
350
-
351
-
352
-
353
-
354
-
355
-
356
-
357
-
358
-
359
-
360
-
361
-
362
-
363
-
364
-
365
-
366
-
367
-
368
-
369
-
370
-
371
-
372
-
373
-
374
-
375
-
376
-
377
-
378
-
379
-
380
-
381
-
382
-
383
-
384
-
385
-
386
-
387
-
388
-
389
-
390
-
391
-
392
-
393
-
394
-
395
-
396
 |
 |

HSBC HOLDINGS PLC
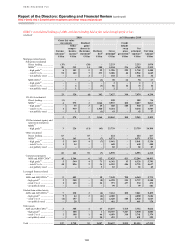
Report of the Directors: Operating and Financial Review (continued)
Risk > Credit risk > Impairment charge
124
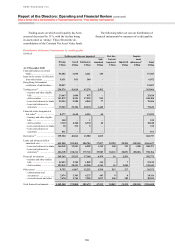
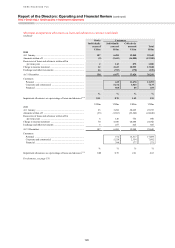
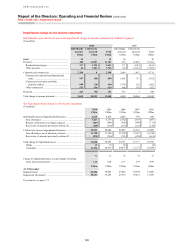
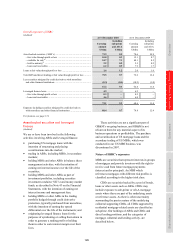
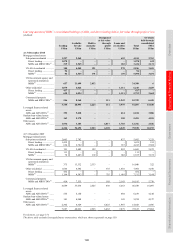
Impairment charge to the income statement
Individually and collectively assessed impairment charge to income statement by industry segment
(Unaudited)
2010 2009
Individually
assessed
US$m
Collectively
assessed
US$m
Total
US$m
Individually
assessed
US$m
Collectively
assessed
US$m
Total
US$m
Banks .................................................................. 12 – 12 70 – 70
Personal ............................................................... 180 11,007 11,187 316 19,465 19,781
Residential mortgages .................................... 137 3,324 3,461 171 4,014 4,185
Other personal ................................................ 43 7,683 7,726 145 15,451 15,596
Corporate and commercial ................................. 2,190 8 2,198 3,699 1,012 4,711
Commercial, industrial and international
trade ............................................................ 997 (88) 909 1,681 711 2,392
Commercial real estate and other
property-related .......................................... 680 (20) 660 1,330 162 1,492
Other commercial ........................................... 513 116 629 688 139 827
Financial ............................................................. 243 (92) 151 373 7 380
Total charge to income statement ....................... 2,625 10,923 13,548 4,458 20,484 24,942
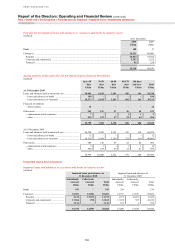
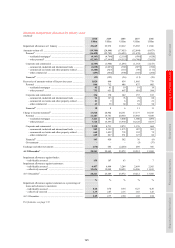
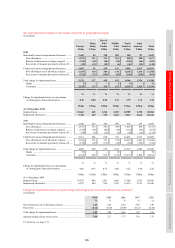
Net loan impairment charge to the income statement
(Unaudited)
2010 2009 2008 2007 2006
US$m US$m US$m US$m US$m
Individually assessed impairment allowances ............................ 2,625 4,458 2,064 796 458
New allowances ....................................................................... 3,617 5,173 2,742 1,533 1,297
Release of allowances no longer required .............................. (847) (581) (565) (608) (711)
Recoveries of amounts previously written off ........................ (145) (134) (113) (129) (128)
Collectively assessed impairment allowances ............................ 10,923 20,484 22,067 16,381 10,089
New allowances net of allowance releases ............................. 11,798 21,240 22,788 17,257 10,740
Recoveries of amounts previously written off ........................ (875) (756) (721) (876) (651)
Total charge for impairment losses ............................................. 13,548 24,942 24,131 17,177 10,547
Banks ...................................................................................... 12 70 54 – (3)
Customers ............................................................................... 13,536 24,872 24,077 17,177 10,550
% % % % %
Charge for impairment losses as a percentage of closing
gross loans and advances ........................................................ 1.14 2.26 2.17 1.39 0.99
US$m US$m US$m US$m US$m
At 31 December
Impaired loans2 ............................................................................ 28,284 30,845 25,422 19,594 15,086
Impairment allowances2 .............................................................. 20,241 25,649 23,972 19,212 13,585
For footnote, see page 174.