HSBC 2010 Annual Report Download - page 171
Download and view the complete annual report
Please find page 171 of the 2010 HSBC annual report below. You can navigate through the pages in the report by either clicking on the pages listed below, or by using the keyword search tool below to find specific information within the annual report.-
 1
1 -
2
-
3
-
4
-
5
-
6
-
7
-
8
-
9
-
10
-
11
-
12
-
13
-
14
-
15
-
16
-
17
-
18
-
19
-
20
-
21
-
22
-
23
-
24
-
25
-
26
-
27
-
28
-
29
-
30
-
31
-
32
-
33
-
34
-
35
-
36
-
37
-
38
-
39
-
40
-
41
-
42
-
43
-
44
-
45
-
46
-
47
-
48
-
49
-
50
-
51
-
52
-
53
-
54
-
55
-
56
-
57
-
58
-
59
-
60
-
61
-
62
-
63
-
64
-
65
-
66
-
67
-
68
-
69
-
70
-
71
-
72
-
73
-
74
-
75
-
76
-
77
-
78
-
79
-
80
-
81
-
82
-
83
-
84
-
85
-
86
-
87
-
88
-
89
-
90
-
91
-
92
-
93
-
94
-
95
-
96
-
97
-
98
-
99
-
100
-
101
-
102
-
103
-
104
-
105
-
106
-
107
-
108
-
109
-
110
-
111
-
112
-
113
-
114
-
115
-
116
-
117
-
118
-
119
-
120
-
121
-
122
-
123
-
124
-
125
-
126
-
127
-
128
-
129
-
130
-
131
-
132
-
133
-
134
-
135
-
136
-
137
-
138
-
139
-
140
-
141
-
142
-
143
-
144
-
145
-
146
-
147
-
148
-
149
-
150
-
151
-
152
-
153
-
154
-
155
-
156
-
157
-
158
-
159
-
160
-
 161
161 -
 162
162 -
 163
163 -
 164
164 -
 165
165 -
 166
166 -
 167
167 -
 168
168 -
 169
169 -
 170
170 -
 171
171 -
 172
172 -
 173
173 -
 174
174 -
 175
175 -
 176
176 -
 177
177 -
 178
178 -
 179
179 -
 180
180 -
 181
181 -
182
-
183
-
184
-
185
-
186
-
187
-
188
-
189
-
190
-
191
-
192
-
193
-
194
-
195
-
196
-
197
-
198
-
199
-
200
-
201
-
202
-
203
-
204
-
205
-
206
-
207
-
208
-
209
-
210
-
211
-
212
-
213
-
214
-
215
-
216
-
217
-
218
-
219
-
220
-
221
-
222
-
223
-
224
-
225
-
226
-
227
-
228
-
229
-
230
-
231
-
232
-
233
-
234
-
235
-
236
-
237
-
238
-
239
-
240
-
241
-
242
-
243
-
244
-
245
-
246
-
247
-
248
-
249
-
250
-
251
-
252
-
253
-
254
-
255
-
256
-
257
-
258
-
259
-
260
-
261
-
262
-
263
-
264
-
265
-
266
-
267
-
268
-
269
-
270
-
271
-
272
-
273
-
274
-
275
-
276
-
277
-
278
-
279
-
280
-
281
-
282
-
283
-
284
-
285
-
286
-
287
-
288
-
289
-
290
-
291
-
292
-
293
-
294
-
295
-
296
-
297
-
298
-
299
-
300
-
301
-
302
-
303
-
304
-
305
-
306
-
307
-
308
-
309
-
310
-
311
-
312
-
313
-
314
-
315
-
316
-
317
-
318
-
319
-
320
-
321
-
322
-
323
-
324
-
325
-
326
-
327
-
328
-
329
-
330
-
331
-
332
-
333
-
334
-
335
-
336
-
337
-
338
-
339
-
340
-
341
-
342
-
343
-
344
-
345
-
346
-
347
-
348
-
349
-
350
-
351
-
352
-
353
-
354
-
355
-
356
-
357
-
358
-
359
-
360
-
361
-
362
-
363
-
364
-
365
-
366
-
367
-
368
-
369
-
370
-
371
-
372
-
373
-
374
-
375
-
376
-
377
-
378
-
379
-
380
-
381
-
382
-
383
-
384
-
385
-
386
-
387
-
388
-
389
-
390
-
391
-
392
-
393
-
394
-
395
-
396
 |
 |

169
Overview Operating & Financial Review Governance Financial Statements Shareholder Information
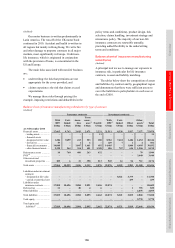
lower, and surrenders or lapses are greater, than
expected.
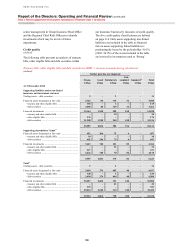
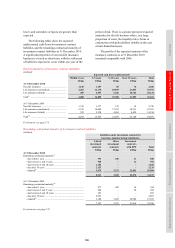
The following tables show the expected
undiscounted cash flows for insurance contract
liabilities and the remaining contractual maturity of
investment contract liabilities at 31 December 2010.
A significant proportion of our non-life insurance
business is viewed as short-term, with the settlement
of liabilities expected to occur within one year of the
period of risk. There is a greater spread of expected
maturities for the life business where, in a large
proportion of cases, the liquidity risk is borne in
conjunction with policyholders (wholly in the case
of unit-linked business).
The profile of the expected maturity of the
insurance contracts as at 31 December 2010
remained comparable with 2009.
Expected maturity of insurance contract liabilities
(Audited)
Expected cash flows (undiscounted)
Within 1 year 1-5 years 5-15 years Over 15 years Total
US$m US$m US$m US$m US$m
At 31 December 2010
Non-life insurance .......................................... 1,140 1,157 83 76 2,456
Life insurance (non-linked) ............................ 2,463 11,178 18,839 21,093 53,573
Life insurance (linked) ................................... 485 2,557 6,366 10,724 20,132
Total81 ............................................................. 4,088 14,892 25,288 31,893 76,161
At 31 December 2009
Non-life insurance .......................................... 1,318 1,277 123 10 2,728
Life insurance (non-linked) ............................ 2,393 10,098 17,253 18,231 47,975
Life insurance (linked) ................................... 522 2,290 4,483 6,899 14,194
Total82 ............................................................. 4,233 13,665 21,859 25,140 64,897
For footnote, see page 174.
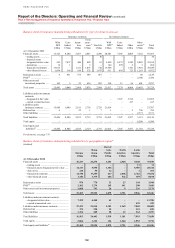
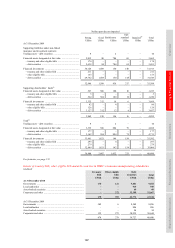
Remaining contractual maturity of investment contract liabilities
(Audited)
Liabilities under investment contracts by
insurance manufacturing subsidiaries
Linked
investment
contracts
Other
investment
contracts
Investment
contracts
with DPF
Total
US$m US$m US$m US$m
At 31 December 2010
Remaining contractual maturity:81
– due within 1 year ................................................................... 391 446 11 848
– due between 1 and 5 years .................................................... 940 – 11 951
– due between 5 and 10 years .................................................. 1,182 – – 1,182
– due after 10 years .................................................................. 2,133 – – 2,133
– undated90 ................................................................................ 3,675 3,372 22,052 29,099
8,321 3,818 22,074 34,213
At 31 December 2009
Remaining contractual maturity:82
– due within 1 year ................................................................... 477 443 14 934
– due between 1 and 5 years .................................................... 904 – 20 924
– due between 5 and 10 years .................................................. 693 – – 693
– due after 10 years .................................................................. 2,093 – – 2,093
– undated90 ................................................................................ 3,180 3,492 20,980 27,652
7,347 3,935 21,014 32,296
For footnotes, see page 174.