HSBC 2010 Annual Report Download - page 13
Download and view the complete annual report
Please find page 13 of the 2010 HSBC annual report below. You can navigate through the pages in the report by either clicking on the pages listed below, or by using the keyword search tool below to find specific information within the annual report.-
 1
1 -
2
-
 3
3 -
 4
4 -
 5
5 -
 6
6 -
 7
7 -
 8
8 -
 9
9 -
 10
10 -
 11
11 -
 12
12 -
 13
13 -
 14
14 -
 15
15 -
 16
16 -
 17
17 -
 18
18 -
 19
19 -
 20
20 -
 21
21 -
 22
22 -
 23
23 -
24
-
25
-
26
-
27
-
28
-
29
-
30
-
31
-
32
-
33
-
34
-
35
-
36
-
37
-
38
-
39
-
40
-
41
-
42
-
43
-
44
-
45
-
46
-
47
-
48
-
49
-
50
-
51
-
52
-
53
-
54
-
55
-
56
-
57
-
58
-
59
-
60
-
61
-
62
-
63
-
64
-
65
-
66
-
67
-
68
-
69
-
70
-
71
-
72
-
73
-
74
-
75
-
76
-
77
-
78
-
79
-
80
-
81
-
82
-
83
-
84
-
85
-
86
-
87
-
88
-
89
-
90
-
91
-
92
-
93
-
94
-
95
-
96
-
97
-
98
-
99
-
100
-
101
-
102
-
103
-
104
-
105
-
106
-
107
-
108
-
109
-
110
-
111
-
112
-
113
-
114
-
115
-
116
-
117
-
118
-
119
-
120
-
121
-
122
-
123
-
124
-
125
-
126
-
127
-
128
-
129
-
130
-
131
-
132
-
133
-
134
-
135
-
136
-
137
-
138
-
139
-
140
-
141
-
142
-
143
-
144
-
145
-
146
-
147
-
148
-
149
-
150
-
151
-
152
-
153
-
154
-
155
-
156
-
157
-
158
-
159
-
160
-
161
-
162
-
163
-
164
-
165
-
166
-
167
-
168
-
169
-
170
-
171
-
172
-
173
-
174
-
175
-
176
-
177
-
178
-
179
-
180
-
181
-
182
-
183
-
184
-
185
-
186
-
187
-
188
-
189
-
190
-
191
-
192
-
193
-
194
-
195
-
196
-
197
-
198
-
199
-
200
-
201
-
202
-
203
-
204
-
205
-
206
-
207
-
208
-
209
-
210
-
211
-
212
-
213
-
214
-
215
-
216
-
217
-
218
-
219
-
220
-
221
-
222
-
223
-
224
-
225
-
226
-
227
-
228
-
229
-
230
-
231
-
232
-
233
-
234
-
235
-
236
-
237
-
238
-
239
-
240
-
241
-
242
-
243
-
244
-
245
-
246
-
247
-
248
-
249
-
250
-
251
-
252
-
253
-
254
-
255
-
256
-
257
-
258
-
259
-
260
-
261
-
262
-
263
-
264
-
265
-
266
-
267
-
268
-
269
-
270
-
271
-
272
-
273
-
274
-
275
-
276
-
277
-
278
-
279
-
280
-
281
-
282
-
283
-
284
-
285
-
286
-
287
-
288
-
289
-
290
-
291
-
292
-
293
-
294
-
295
-
296
-
297
-
298
-
299
-
300
-
301
-
302
-
303
-
304
-
305
-
306
-
307
-
308
-
309
-
310
-
311
-
312
-
313
-
314
-
315
-
316
-
317
-
318
-
319
-
320
-
321
-
322
-
323
-
324
-
325
-
326
-
327
-
328
-
329
-
330
-
331
-
332
-
333
-
334
-
335
-
336
-
337
-
338
-
339
-
340
-
341
-
342
-
343
-
344
-
345
-
346
-
347
-
348
-
349
-
350
-
351
-
352
-
353
-
354
-
355
-
356
-
357
-
358
-
359
-
360
-
361
-
362
-
363
-
364
-
365
-
366
-
367
-
368
-
369
-
370
-
371
-
372
-
373
-
374
-
375
-
376
-
377
-
378
-
379
-
380
-
381
-
382
-
383
-
384
-
385
-
386
-
387
-
388
-
389
-
390
-
391
-
392
-
393
-
394
-
395
-
396
 |
 |

11
Overview Operating & Financial Review Governance Financial Statements Shareholder Information
Top and emerging risks
All of our activities involve, to varying degrees,
the measurement, evaluation, acceptance and
management of risk or combinations of risks. We
classify risks as ‘top’ and ‘emerging’. A ‘top risk’
is a current, visible risk with the potential to have
a material effect on our financial results or our
reputation. An ‘emerging risk’ is one which has
large unknown components which could have a
material impact on our long-term strategy. Top and
emerging risks are viewed as falling under the
following four broad categories:
• challenges to our business operations;
• challenges to our governance and internal
control systems;
• macro-economic and geopolitical risk; and
• macro-prudential and regulatory risks to our
business model.
The top and emerging risks are summarised
below:
Challenges to our business operations
• Challenges to our operating model in an economic downturn
(in developed countries) and rapid growth (in emerging
markets)
• Internet crime and fraud
Challenges to our governance and internal control systems
• Level of change creating operational complexity
• Information security risk
Macro-economic and geopolitical risk
• Potential emerging markets asset bubble
• Increased geopolitical risk in Asia-Pacific and Middle East
regions
Macro-prudential and regulatory risks to our business
model
• Regulatory change impacting our business model and Group
profitability
• Regulatory requirements affecting conduct of business
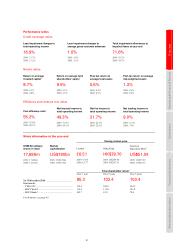
Key performance indicators
The Board of Directors and the Group Management
Board (‘GMB’) monitor HSBC’s progress against
its strategic objectives. Progress is assessed by
comparison with our strategy, our operating plan
targets and our historical performance using both
financial and non-financial measures.
Following a review of our high-level key
performance indicators (‘KPI’s), the GMB decided
to make the following changes to the Group’s
published indicators in order to restrict their number
to those which most accurately reflect its
management priorities. The Group now has seven
financial and three non-financial KPIs.
• the ratio of advances to core funding has been
added to highlight the relationship between
loans and advances to customers and core
customer deposits in our principal banking
entities;
• tier 1 capital has been added as a primary
indicator of the strength of our capital base, and
its ability to support the growth of the business
and meet regulatory capital requirements;
• revenue growth, revenue mix factors and credit
performance as measured by risk-adjusted
margin have been replaced with risk-adjusted
revenue growth;
• the GMB will prioritise return on average total
shareholders’ equity in place of return on
average invested capital, which has therefore
been excluded; and
• customer transactions processed and percentage
of information technology (‘IT’) services
meeting targets form part of management
information within our IT function. However,
the GMB decided that these measures, which we
have previously disclosed, were not appropriate
proxies for assessing efficiencies and progress
with implementing standard systems
architecture.