HSBC 2010 Annual Report Download - page 298
Download and view the complete annual report
Please find page 298 of the 2010 HSBC annual report below. You can navigate through the pages in the report by either clicking on the pages listed below, or by using the keyword search tool below to find specific information within the annual report.-
 1
1 -
2
-
3
-
4
-
5
-
6
-
7
-
8
-
9
-
10
-
11
-
12
-
13
-
14
-
15
-
16
-
17
-
18
-
19
-
20
-
21
-
22
-
23
-
24
-
25
-
26
-
27
-
28
-
29
-
30
-
31
-
32
-
33
-
34
-
35
-
36
-
37
-
38
-
39
-
40
-
41
-
42
-
43
-
44
-
45
-
46
-
47
-
48
-
49
-
50
-
51
-
52
-
53
-
54
-
55
-
56
-
57
-
58
-
59
-
60
-
61
-
62
-
63
-
64
-
65
-
66
-
67
-
68
-
69
-
70
-
71
-
72
-
73
-
74
-
75
-
76
-
77
-
78
-
79
-
80
-
81
-
82
-
83
-
84
-
85
-
86
-
87
-
88
-
89
-
90
-
91
-
92
-
93
-
94
-
95
-
96
-
97
-
98
-
99
-
100
-
101
-
102
-
103
-
104
-
105
-
106
-
107
-
108
-
109
-
110
-
111
-
112
-
113
-
114
-
115
-
116
-
117
-
118
-
119
-
120
-
121
-
122
-
123
-
124
-
125
-
126
-
127
-
128
-
129
-
130
-
131
-
132
-
133
-
134
-
135
-
136
-
137
-
138
-
139
-
140
-
141
-
142
-
143
-
144
-
145
-
146
-
147
-
148
-
149
-
150
-
151
-
152
-
153
-
154
-
155
-
156
-
157
-
158
-
159
-
160
-
161
-
162
-
163
-
164
-
165
-
166
-
167
-
168
-
169
-
170
-
171
-
172
-
173
-
174
-
175
-
176
-
177
-
178
-
179
-
180
-
181
-
182
-
183
-
184
-
185
-
186
-
187
-
188
-
189
-
190
-
191
-
192
-
193
-
194
-
195
-
196
-
197
-
198
-
199
-
200
-
201
-
202
-
203
-
204
-
205
-
206
-
207
-
208
-
209
-
210
-
211
-
212
-
213
-
214
-
215
-
216
-
217
-
218
-
219
-
220
-
221
-
222
-
223
-
224
-
225
-
226
-
227
-
228
-
229
-
230
-
231
-
232
-
233
-
234
-
235
-
236
-
237
-
238
-
239
-
240
-
241
-
242
-
243
-
244
-
245
-
246
-
247
-
248
-
249
-
250
-
251
-
252
-
253
-
254
-
255
-
256
-
257
-
258
-
259
-
260
-
261
-
262
-
263
-
264
-
265
-
266
-
267
-
268
-
269
-
270
-
271
-
272
-
273
-
274
-
275
-
276
-
277
-
278
-
279
-
280
-
281
-
282
-
283
-
284
-
285
-
286
-
287
-
 288
288 -
 289
289 -
 290
290 -
 291
291 -
 292
292 -
 293
293 -
 294
294 -
 295
295 -
 296
296 -
 297
297 -
 298
298 -
 299
299 -
 300
300 -
 301
301 -
 302
302 -
 303
303 -
 304
304 -
 305
305 -
 306
306 -
 307
307 -
 308
308 -
309
-
310
-
311
-
312
-
313
-
314
-
315
-
316
-
317
-
318
-
319
-
320
-
321
-
322
-
323
-
324
-
325
-
326
-
327
-
328
-
329
-
330
-
331
-
332
-
333
-
334
-
335
-
336
-
337
-
338
-
339
-
340
-
341
-
342
-
343
-
344
-
345
-
346
-
347
-
348
-
349
-
350
-
351
-
352
-
353
-
354
-
355
-
356
-
357
-
358
-
359
-
360
-
361
-
362
-
363
-
364
-
365
-
366
-
367
-
368
-
369
-
370
-
371
-
372
-
373
-
374
-
375
-
376
-
377
-
378
-
379
-
380
-
381
-
382
-
383
-
384
-
385
-
386
-
387
-
388
-
389
-
390
-
391
-
392
-
393
-
394
-
395
-
396
 |
 |

HSBC HOLDINGS PLC
Notes on the Financial Statements (continued)
12 – Earnings per share / 13 – Segmental analysis
296
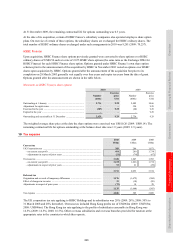
The Directors declared after the end of the year a fourth interim dividend in respect of the financial year ended
31 December 2010 of US$0.12 per ordinary share, a distribution of approximately US$2,125m. The fourth interim
dividend will be payable on 5 May 2011 to holders of record on 17 March 2011 on the Hong Kong Overseas Branch
Register and 18 March 2011 on the Principal Register in the UK or the Bermuda Overseas Branch Register. No
liability is recorded in the financial statements in respect of the fourth interim dividend for 2010.
On 18 January 2011, HSBC paid a further coupon on the capital securities of US$0.508 per security, a distribution of
US$44m. No liability is recorded in the balance sheet at 31 December 2010 in respect of this coupon payment.
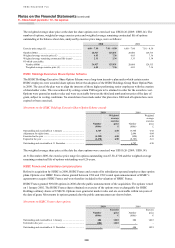
12 Earnings per share
Basic earnings per ordinary share was calculated by dividing the profit attributable to ordinary shareholders of the
parent company by the weighted average number of ordinary shares outstanding, excluding own shares held. Diluted
earnings per ordinary share was calculated by dividing the basic earnings, which require no adjustment for the effects
of dilutive potential ordinary shares, by the weighted average number of ordinary shares outstanding, excluding own
shares held, plus the weighted average number of ordinary shares that would be issued on conversion of dilutive
potential ordinary shares.
Profit attributable to the ordinary shareholders of the parent company
2010 2009 2008
US$m US$m US$m
Profit attributable to shareholders of the parent company ......................................... 13,159 5,834 5,728
Dividend payable on preference shares classified as equity ...................................... (90) (90) (90)
Coupon payable on capital securities classified as equity ......................................... (323) (179) (92)
Profit attributable to the ordinary shareholders of the parent company ..................... 12,746 5,565 5,546
Basic and diluted earnings per share
2010 2009 2008
Profit
US$m
Number
of shares
(millions)
Per
share
US$
Profit
US$m
Number
of shares
(millions)
Per
share
US$
Profit
US$m
Number
of shares
(millions)
Per
share
US$
Basic1 .......................................................... 12,746 17,404 0.73 5,565 16,277 0.34 5,546 13,555 0.41
Effect of dilutive potential ordinary shares. 229 143 118
– Savings-related Share Option Plan .... 55 26 13
– Executive Share Option Scheme ........ – – 3
– Group Share Option Plan ................... – – 5
– Restricted and performance share
awards ............................................ 174 117 95
– HSBC France share options ............... – – 1
– HSBC Finance share options ............. – – 1
Diluted2 ....................................................... 12,746 17,633 0.72 5,565 16,420 0.34 5,546 13,673 0.41
1 Weighted average number of ordinary shares outstanding.
2 Weighted average number of ordinary shares outstanding assuming dilution.
The weighted average number of dilutive potential ordinary shares excludes 150m employee share options that were
anti-dilutive (2009: 214m; 2008: 166m).
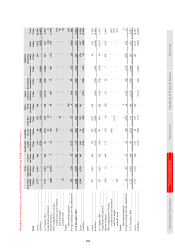
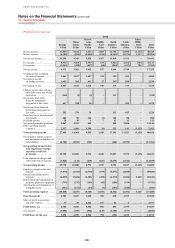
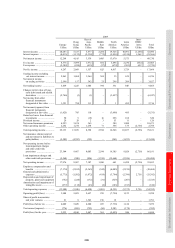
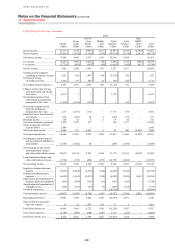
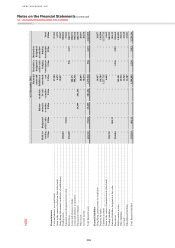
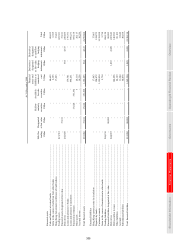
13 Segmental analysis
HSBC’s operating segments are organised into six geographical regions, Europe, Hong Kong, Rest of Asia-Pacific,
Middle East, North America and Latin America. Due to the nature of the Group, HSBC’s chief operating decision-
maker regularly reviews operating activity on a number of bases, including by geographical region, customer group
and global business and retail businesses by geographical region. The segmental analysis is presented on a
geographical basis because, although information is reviewed on a number of bases, capital resources are allocated
and performance is assessed primarily by geographical region. Also, the economic conditions of each geographical
region are highly influential in determining the performance of the different businesses carried out in each region. As
a result, provision of segmental information on a geographical basis provides the most meaningful basis from which