HSBC 2010 Annual Report Download - page 83
Download and view the complete annual report
Please find page 83 of the 2010 HSBC annual report below. You can navigate through the pages in the report by either clicking on the pages listed below, or by using the keyword search tool below to find specific information within the annual report.-
 1
1 -
2
-
3
-
4
-
5
-
6
-
7
-
8
-
9
-
10
-
11
-
12
-
13
-
14
-
15
-
16
-
17
-
18
-
19
-
20
-
21
-
22
-
23
-
24
-
25
-
26
-
27
-
28
-
29
-
30
-
31
-
32
-
33
-
34
-
35
-
36
-
37
-
38
-
39
-
40
-
41
-
42
-
43
-
44
-
45
-
46
-
47
-
48
-
49
-
50
-
51
-
52
-
53
-
54
-
55
-
56
-
57
-
58
-
59
-
60
-
61
-
62
-
63
-
64
-
65
-
66
-
67
-
68
-
69
-
70
-
71
-
72
-
 73
73 -
 74
74 -
 75
75 -
 76
76 -
 77
77 -
 78
78 -
 79
79 -
 80
80 -
 81
81 -
 82
82 -
 83
83 -
 84
84 -
 85
85 -
 86
86 -
 87
87 -
 88
88 -
 89
89 -
 90
90 -
 91
91 -
 92
92 -
 93
93 -
94
-
95
-
96
-
97
-
98
-
99
-
100
-
101
-
102
-
103
-
104
-
105
-
106
-
107
-
108
-
109
-
110
-
111
-
112
-
113
-
114
-
115
-
116
-
117
-
118
-
119
-
120
-
121
-
122
-
123
-
124
-
125
-
126
-
127
-
128
-
129
-
130
-
131
-
132
-
133
-
134
-
135
-
136
-
137
-
138
-
139
-
140
-
141
-
142
-
143
-
144
-
145
-
146
-
147
-
148
-
149
-
150
-
151
-
152
-
153
-
154
-
155
-
156
-
157
-
158
-
159
-
160
-
161
-
162
-
163
-
164
-
165
-
166
-
167
-
168
-
169
-
170
-
171
-
172
-
173
-
174
-
175
-
176
-
177
-
178
-
179
-
180
-
181
-
182
-
183
-
184
-
185
-
186
-
187
-
188
-
189
-
190
-
191
-
192
-
193
-
194
-
195
-
196
-
197
-
198
-
199
-
200
-
201
-
202
-
203
-
204
-
205
-
206
-
207
-
208
-
209
-
210
-
211
-
212
-
213
-
214
-
215
-
216
-
217
-
218
-
219
-
220
-
221
-
222
-
223
-
224
-
225
-
226
-
227
-
228
-
229
-
230
-
231
-
232
-
233
-
234
-
235
-
236
-
237
-
238
-
239
-
240
-
241
-
242
-
243
-
244
-
245
-
246
-
247
-
248
-
249
-
250
-
251
-
252
-
253
-
254
-
255
-
256
-
257
-
258
-
259
-
260
-
261
-
262
-
263
-
264
-
265
-
266
-
267
-
268
-
269
-
270
-
271
-
272
-
273
-
274
-
275
-
276
-
277
-
278
-
279
-
280
-
281
-
282
-
283
-
284
-
285
-
286
-
287
-
288
-
289
-
290
-
291
-
292
-
293
-
294
-
295
-
296
-
297
-
298
-
299
-
300
-
301
-
302
-
303
-
304
-
305
-
306
-
307
-
308
-
309
-
310
-
311
-
312
-
313
-
314
-
315
-
316
-
317
-
318
-
319
-
320
-
321
-
322
-
323
-
324
-
325
-
326
-
327
-
328
-
329
-
330
-
331
-
332
-
333
-
334
-
335
-
336
-
337
-
338
-
339
-
340
-
341
-
342
-
343
-
344
-
345
-
346
-
347
-
348
-
349
-
350
-
351
-
352
-
353
-
354
-
355
-
356
-
357
-
358
-
359
-
360
-
361
-
362
-
363
-
364
-
365
-
366
-
367
-
368
-
369
-
370
-
371
-
372
-
373
-
374
-
375
-
376
-
377
-
378
-
379
-
380
-
381
-
382
-
383
-
384
-
385
-
386
-
387
-
388
-
389
-
390
-
391
-
392
-
393
-
394
-
395
-
396
 |
 |

81
Overview Operating & Financial Review Governance Financial Statements Shareholder Information
Other information
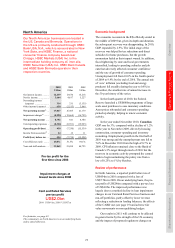
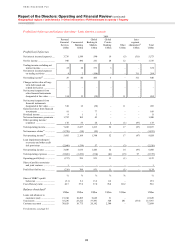
Funds under management and assets held in
custody
Funds under management
2010 2009
US$bn US$bn
Funds under management
At 1 January ................................. 857 735
Net new money ............................ 42 36
Value change ............................... 33 76
Exchange and other ..................... (7) 10
At 31 December ........................... 925 857
At 31 December
2010 2009
US$bn US$bn
Funds under management by
business
Global Asset Management .......... 439 423
Global Private Banking ............... 277 251
Affiliates ...................................... 3 3
Other ............................................ 206 180
925 857
Funds under management at 31 December 2010
amounted to US$925bn, an increase of 8%
when compared with 2009. Both Global Asset
Management and GPB fund holdings increased,
reflecting an improvement in equity market
performance and strong net inflows.
Global Asset Management funds, including
emerging market funds, increased by 4% to
US$439bn as a result of market performance gains
and strong net inflows, particularly in Europe and
Asia, partly offset by adverse foreign exchange
movements. We remain one of the world’s largest
emerging market asset managers with funds under
management of US$145bn at 31 December 2010 in
countries outside North America, Western Europe,
Japan and Australia.
GPB funds increased by 10% in 2010 to
US$277bn, driven by an improvement in equity
market performance and strong net inflows which
benefited from our strength in emerging markets,
hiring of key relationship managers and cross-
business referrals. Client assets, which include funds
under management and cash deposits and provide an
indicator of the scale of GPB, increased by US$23bn
to US$390bn due to the increase in funds under
management.
Other funds under management, which are
mainly held by a corporate trust business in Asia,
increased by 14% to US$206bn.
We announced in November 2010 that, with
effect from 1 March 2011, Retail Banking and
Wealth Management will be managed as a single
global business from Hong Kong. Global Asset
Management will become part of this business and
will be transferred from GB&M.
Assets held in custody and under
administration
Custody is the safekeeping and servicing of
securities and other financial assets on behalf of
clients. At 31 December 2010, we held assets as
custodian of US$5.7 trillion, 9% higher than the
US$5.2 trillion held at 31 December 2009. This was
mainly driven by an increase in the market value of
assets and favourable foreign exchange movements.
Our assets under administration business, which
includes the provision of various support function
activities including the valuation of portfolios of
securities and other financial assets on behalf of
clients, complements the custody business. At
31 December 2010, the value of assets held under
administration by the Group amounted to
US$2.7 trillion, compared with US$2.8 trillion
in 2009.
Property
At 31 December 2010, we operated from some
9,950 operational properties worldwide, of which
approximately 2,500 were located in Europe, 3,100
in Hong Kong and Rest of Asia-Pacific, 800 in North
America, 3,350 in Latin America and 200 in the
Middle East. These properties had an area of
approximately 71.3m square feet (2009: 70.8m
square feet).
Our freehold and long leasehold properties,
together with all our leasehold land in Hong Kong,
were valued in 2010. The value of these properties
was US$7.1bn (2009: US$4.1bn) in excess of their
carrying amount in the consolidated balance sheet.
In addition, properties with a net book value of
US$1,133m were held for investment purposes.
HSBC’s operational properties are stated at cost,
being historical cost or fair value at the date of
transition to IFRSs (their deemed cost) less any
impairment losses, and are depreciated on a basis
calculated to write off the assets over their estimated
useful lives. Properties owned as a consequence of
an acquisition are recognised initially at fair value.
Further details are included in Note 25 on the
Financial Statements.