HSBC 2010 Annual Report Download - page 342
Download and view the complete annual report
Please find page 342 of the 2010 HSBC annual report below. You can navigate through the pages in the report by either clicking on the pages listed below, or by using the keyword search tool below to find specific information within the annual report.-
 1
1 -
2
-
3
-
4
-
5
-
6
-
7
-
8
-
9
-
10
-
11
-
12
-
13
-
14
-
15
-
16
-
17
-
18
-
19
-
20
-
21
-
22
-
23
-
24
-
25
-
26
-
27
-
28
-
29
-
30
-
31
-
32
-
33
-
34
-
35
-
36
-
37
-
38
-
39
-
40
-
41
-
42
-
43
-
44
-
45
-
46
-
47
-
48
-
49
-
50
-
51
-
52
-
53
-
54
-
55
-
56
-
57
-
58
-
59
-
60
-
61
-
62
-
63
-
64
-
65
-
66
-
67
-
68
-
69
-
70
-
71
-
72
-
73
-
74
-
75
-
76
-
77
-
78
-
79
-
80
-
81
-
82
-
83
-
84
-
85
-
86
-
87
-
88
-
89
-
90
-
91
-
92
-
93
-
94
-
95
-
96
-
97
-
98
-
99
-
100
-
101
-
102
-
103
-
104
-
105
-
106
-
107
-
108
-
109
-
110
-
111
-
112
-
113
-
114
-
115
-
116
-
117
-
118
-
119
-
120
-
121
-
122
-
123
-
124
-
125
-
126
-
127
-
128
-
129
-
130
-
131
-
132
-
133
-
134
-
135
-
136
-
137
-
138
-
139
-
140
-
141
-
142
-
143
-
144
-
145
-
146
-
147
-
148
-
149
-
150
-
151
-
152
-
153
-
154
-
155
-
156
-
157
-
158
-
159
-
160
-
161
-
162
-
163
-
164
-
165
-
166
-
167
-
168
-
169
-
170
-
171
-
172
-
173
-
174
-
175
-
176
-
177
-
178
-
179
-
180
-
181
-
182
-
183
-
184
-
185
-
186
-
187
-
188
-
189
-
190
-
191
-
192
-
193
-
194
-
195
-
196
-
197
-
198
-
199
-
200
-
201
-
202
-
203
-
204
-
205
-
206
-
207
-
208
-
209
-
210
-
211
-
212
-
213
-
214
-
215
-
216
-
217
-
218
-
219
-
220
-
221
-
222
-
223
-
224
-
225
-
226
-
227
-
228
-
229
-
230
-
231
-
232
-
233
-
234
-
235
-
236
-
237
-
238
-
239
-
240
-
241
-
242
-
243
-
244
-
245
-
246
-
247
-
248
-
249
-
250
-
251
-
252
-
253
-
254
-
255
-
256
-
257
-
258
-
259
-
260
-
261
-
262
-
263
-
264
-
265
-
266
-
267
-
268
-
269
-
270
-
271
-
272
-
273
-
274
-
275
-
276
-
277
-
278
-
279
-
280
-
281
-
282
-
283
-
284
-
285
-
286
-
287
-
288
-
289
-
290
-
291
-
292
-
293
-
294
-
295
-
296
-
297
-
298
-
299
-
300
-
301
-
302
-
303
-
304
-
305
-
306
-
307
-
308
-
309
-
310
-
311
-
312
-
313
-
314
-
315
-
316
-
317
-
318
-
319
-
320
-
321
-
322
-
323
-
324
-
325
-
326
-
327
-
328
-
329
-
330
-
331
-
 332
332 -
 333
333 -
 334
334 -
 335
335 -
 336
336 -
 337
337 -
 338
338 -
 339
339 -
 340
340 -
 341
341 -
 342
342 -
 343
343 -
 344
344 -
 345
345 -
 346
346 -
 347
347 -
 348
348 -
 349
349 -
 350
350 -
 351
351 -
 352
352 -
353
-
354
-
355
-
356
-
357
-
358
-
359
-
360
-
361
-
362
-
363
-
364
-
365
-
366
-
367
-
368
-
369
-
370
-
371
-
372
-
373
-
374
-
375
-
376
-
377
-
378
-
379
-
380
-
381
-
382
-
383
-
384
-
385
-
386
-
387
-
388
-
389
-
390
-
391
-
392
-
393
-
394
-
395
-
396
 |
 |

HSBC HOLDINGS PLC
Notes on the Financial Statements (continued)
27 – Other assets / 28 – Trading liabilities / 29 – Financial liabilities at fair value / 30 – Debt securities in issue
340
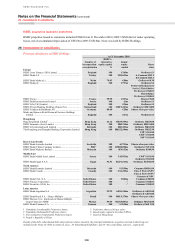
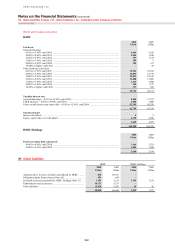
Acquisitions
There were minor acquisitions and increases in investment in subsidiaries which increased goodwill by US$16m.
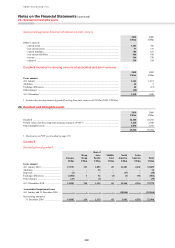
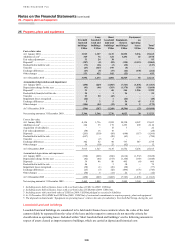
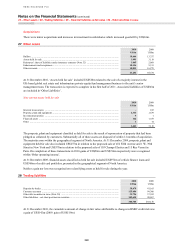
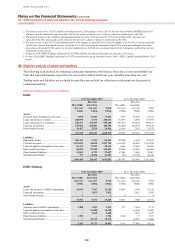
27 Other assets
2010 2009
US$m US$m
Bullion ...................................................................................................................................................... 18,446 13,757
Assets held for sale ................................................................................................................................... 1,991 3,118
Reinsurers’ share of liabilities under insurance contracts (Note 32) ....................................................... 1,865 2,069
Endorsements and acceptances ................................................................................................................. 10,116 9,311
Other accounts .......................................................................................................................................... 10,833 16,279
43,251 44,534
At 31 December 2010, ‘Assets held for sale’ included US$520m related to the sale of a majority interest in the
UK-based global real estate and infrastructure private equity fund management business to the unit’s senior
management team. The transaction is expected to complete in the first half of 2011. Associated liabilities of US$86m
are included in ‘Other Liabilities’.
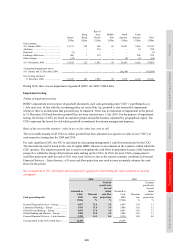
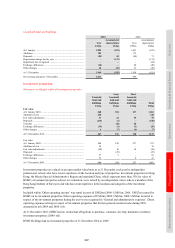
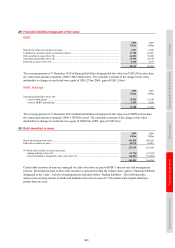
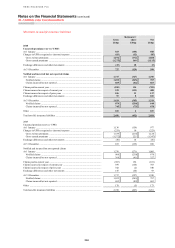
Non-current assets held for sale
2010 2009
US$m US$m
Interests in associates ............................................................................................................................... – 105
Property, plant and equipment .................................................................................................................. 1,333 1,639
Investment properties ............................................................................................................................... 9 1
Financial assets ......................................................................................................................................... 116 1,359
Other ......................................................................................................................................................... 3 14
1,461 3,118
The property, plant and equipment classified as held for sale is the result of repossession of property that had been
pledged as collateral by customers. Substantially all of these assets are disposed of within 12 months of acquisition.
The majority arose within the geographical segment of North America. At 31 December 2009, property, plant and
equipment held for sale also included US$257m in relation to the proposed sale of 452 Fifth Avenue and 1 W. 39th
Street in New York and US$370m in relation to the proposed sale of 103 Champs Elysées and 15 Rue Vernet in
Paris. On completion of these transactions in 2010 gains of US$56m and US$194m respectively were recognised
within ‘Other operating income’.
At 31 December 2009, financial assets classified as held for sale included US$972m of vehicle finance loans and
US$366m of credit card portfolios, presented in the geographical segment of North America.
Neither a gain nor loss was recognised on reclassifying assets as held for sale during the year.
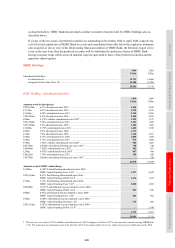
28 Trading liabilities
2010
US$m
2009
US$m
Deposits by banks ..................................................................................................................................... 38,678 41,165
Customer accounts .................................................................................................................................... 125,684 99,306
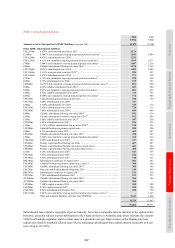
Other debt securities in issue (Note 30) ................................................................................................... 33,726 37,592
Other liabilities – net short positions in securities .................................................................................... 102,615 90,067
300,703 268,130
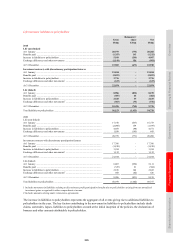
At 31 December 2010, the cumulative amount of change in fair value attributable to changes in HSBC credit risk was
a gain of US$142m (2009: gain of US$119m).