HSBC 2010 Annual Report Download - page 70
Download and view the complete annual report
Please find page 70 of the 2010 HSBC annual report below. You can navigate through the pages in the report by either clicking on the pages listed below, or by using the keyword search tool below to find specific information within the annual report.-
 1
1 -
2
-
3
-
4
-
5
-
6
-
7
-
8
-
9
-
10
-
11
-
12
-
13
-
14
-
15
-
16
-
17
-
18
-
19
-
20
-
21
-
22
-
23
-
24
-
25
-
26
-
27
-
28
-
29
-
30
-
31
-
32
-
33
-
34
-
35
-
36
-
37
-
38
-
39
-
40
-
41
-
42
-
43
-
44
-
45
-
46
-
47
-
48
-
49
-
50
-
51
-
52
-
53
-
54
-
55
-
56
-
57
-
58
-
59
-
 60
60 -
 61
61 -
 62
62 -
 63
63 -
 64
64 -
 65
65 -
 66
66 -
 67
67 -
 68
68 -
 69
69 -
 70
70 -
 71
71 -
 72
72 -
 73
73 -
 74
74 -
 75
75 -
 76
76 -
 77
77 -
 78
78 -
 79
79 -
 80
80 -
81
-
82
-
83
-
84
-
85
-
86
-
87
-
88
-
89
-
90
-
91
-
92
-
93
-
94
-
95
-
96
-
97
-
98
-
99
-
100
-
101
-
102
-
103
-
104
-
105
-
106
-
107
-
108
-
109
-
110
-
111
-
112
-
113
-
114
-
115
-
116
-
117
-
118
-
119
-
120
-
121
-
122
-
123
-
124
-
125
-
126
-
127
-
128
-
129
-
130
-
131
-
132
-
133
-
134
-
135
-
136
-
137
-
138
-
139
-
140
-
141
-
142
-
143
-
144
-
145
-
146
-
147
-
148
-
149
-
150
-
151
-
152
-
153
-
154
-
155
-
156
-
157
-
158
-
159
-
160
-
161
-
162
-
163
-
164
-
165
-
166
-
167
-
168
-
169
-
170
-
171
-
172
-
173
-
174
-
175
-
176
-
177
-
178
-
179
-
180
-
181
-
182
-
183
-
184
-
185
-
186
-
187
-
188
-
189
-
190
-
191
-
192
-
193
-
194
-
195
-
196
-
197
-
198
-
199
-
200
-
201
-
202
-
203
-
204
-
205
-
206
-
207
-
208
-
209
-
210
-
211
-
212
-
213
-
214
-
215
-
216
-
217
-
218
-
219
-
220
-
221
-
222
-
223
-
224
-
225
-
226
-
227
-
228
-
229
-
230
-
231
-
232
-
233
-
234
-
235
-
236
-
237
-
238
-
239
-
240
-
241
-
242
-
243
-
244
-
245
-
246
-
247
-
248
-
249
-
250
-
251
-
252
-
253
-
254
-
255
-
256
-
257
-
258
-
259
-
260
-
261
-
262
-
263
-
264
-
265
-
266
-
267
-
268
-
269
-
270
-
271
-
272
-
273
-
274
-
275
-
276
-
277
-
278
-
279
-
280
-
281
-
282
-
283
-
284
-
285
-
286
-
287
-
288
-
289
-
290
-
291
-
292
-
293
-
294
-
295
-
296
-
297
-
298
-
299
-
300
-
301
-
302
-
303
-
304
-
305
-
306
-
307
-
308
-
309
-
310
-
311
-
312
-
313
-
314
-
315
-
316
-
317
-
318
-
319
-
320
-
321
-
322
-
323
-
324
-
325
-
326
-
327
-
328
-
329
-
330
-
331
-
332
-
333
-
334
-
335
-
336
-
337
-
338
-
339
-
340
-
341
-
342
-
343
-
344
-
345
-
346
-
347
-
348
-
349
-
350
-
351
-
352
-
353
-
354
-
355
-
356
-
357
-
358
-
359
-
360
-
361
-
362
-
363
-
364
-
365
-
366
-
367
-
368
-
369
-
370
-
371
-
372
-
373
-
374
-
375
-
376
-
377
-
378
-
379
-
380
-
381
-
382
-
383
-
384
-
385
-
386
-
387
-
388
-
389
-
390
-
391
-
392
-
393
-
394
-
395
-
396
 |
 |

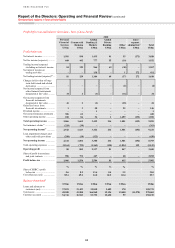
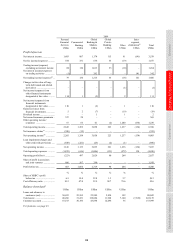
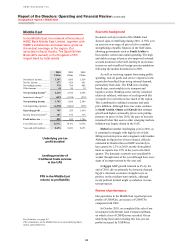
HSBC HOLDINGS PLC
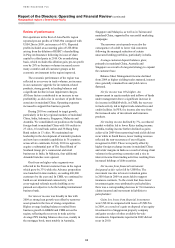
Report of the Directors: Operating and Financial Review (continued)
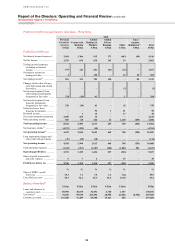
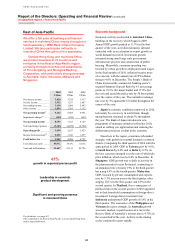
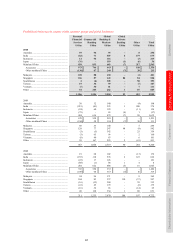
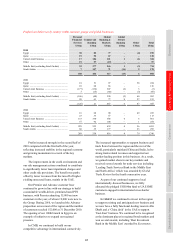
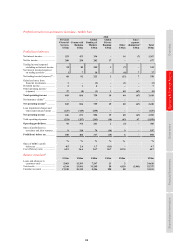
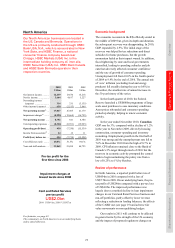
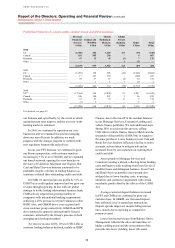
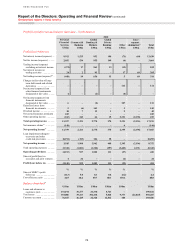
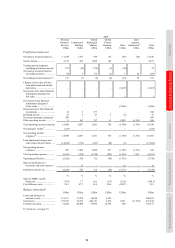
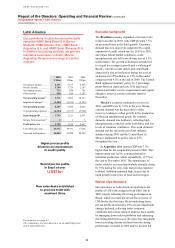
Geographical regions > Middle East
68
Net interest income decreased by 8% as average
lending balances declined in both PFS and CMB, the
proportion of higher yielding assets fell and the cost
of liquidity remained high.
In PFS, spreads narrowed as we focused new
lending on Premier and Advance customers, while
concurrently managing down higher risk unsecured
lending balances, mostly in the UAE.
In CMB, asset balances and net interest income
rose throughout the second half of 2010 as
increasing trade finance balances contributed to
growing revenues.
Average customer accounts declined as
corporate customers reduced their deposits in
response to tighter liquidity in the local markets.
This was partly offset by an increase in average
liability balances in PFS, which was driven by
successful deposit campaigns launched in 2010 and
by the acquisition of Premier and A dvance
customers. Our overall liquidity position improved
although the market returns on the deployment of
liquidity remained low.
Net fee income increased by 8%, primarily
driven by higher volumes of credit facilities related
to trade, guarantees and remittances in CMB. The
benefit was partly offset by lower advisory revenues
from equity capital markets in GB&M as a result of
limited issuances in the regional equity markets.
Net trading income fell by 6% to US$370m.
Subdued trading conditions and the non-recurrence
of gains which had resulted from the tightening of
credit spreads on certain positions in early 2009
resulted in lower Credit trading income. Foreign
exchange income decreased with the easing in
market volatility as speculation regarding the
unpegging of Gulf currencies from the US dollar
receded.
Other operating income declined by US$37m as
gains arising in 2009 from the buy-back and
extinguishment of own debt did not recur.
Loan impairment charges and other credit risk
provisions decreased by 53%. An overall
improvement in credit conditions in the region along
with enhanced collections processes, improvements
in the quality of our customer base and a reduction
in unsecured lending resulted in significantly lower
net collective impairment provisions, notably in the
UAE, and lower requirements for specific corporate
provisions.
In PFS, strengthened collections processes
and a repositioning of the loan book contributed to
lower delinquency rates. In CMB, loan impairment
charges and other credit risk provisions decreased
due to significantly lower net collectively assessed
impairment charges and fewer specific loan
impairment charges, with the majority of the charge
in 2010 relating to a small number of large corporate
customers.
Loan impairment charges and other credit risk
provisions in GB&M rose, mainly from restructuring
activity which drove UAE-related loan impairments
for a small number of large corporate customers in
the first half of 2010. The improvement in economic
conditions during the latter part of 2010 resulted in
lower loan impairment charges in the second half of
the year.
Operating expenses increased by 8%, driven by
increased investment in marketing and advertising,
including key sponsorship deals and the promotion
of the HSBC brand through strategic messaging in
the Abu Dhabi and Dubai airports, together with an
increase in premises and people costs, mainly from
the investment in the branch network expansion in
Egypt.
Profit from associates and joint ventures
decreased by 5%. The contribution from The
Saudi British Bank was lower as revenue fell in
challenging operating conditions.