HSBC 2010 Annual Report Download - page 21
Download and view the complete annual report
Please find page 21 of the 2010 HSBC annual report below. You can navigate through the pages in the report by either clicking on the pages listed below, or by using the keyword search tool below to find specific information within the annual report.-
 1
1 -
2
-
3
-
4
-
5
-
6
-
7
-
8
-
9
-
10
-
 11
11 -
 12
12 -
 13
13 -
 14
14 -
 15
15 -
 16
16 -
 17
17 -
 18
18 -
 19
19 -
 20
20 -
 21
21 -
 22
22 -
 23
23 -
 24
24 -
 25
25 -
 26
26 -
 27
27 -
 28
28 -
 29
29 -
 30
30 -
 31
31 -
32
-
33
-
34
-
35
-
36
-
37
-
38
-
39
-
40
-
41
-
42
-
43
-
44
-
45
-
46
-
47
-
48
-
49
-
50
-
51
-
52
-
53
-
54
-
55
-
56
-
57
-
58
-
59
-
60
-
61
-
62
-
63
-
64
-
65
-
66
-
67
-
68
-
69
-
70
-
71
-
72
-
73
-
74
-
75
-
76
-
77
-
78
-
79
-
80
-
81
-
82
-
83
-
84
-
85
-
86
-
87
-
88
-
89
-
90
-
91
-
92
-
93
-
94
-
95
-
96
-
97
-
98
-
99
-
100
-
101
-
102
-
103
-
104
-
105
-
106
-
107
-
108
-
109
-
110
-
111
-
112
-
113
-
114
-
115
-
116
-
117
-
118
-
119
-
120
-
121
-
122
-
123
-
124
-
125
-
126
-
127
-
128
-
129
-
130
-
131
-
132
-
133
-
134
-
135
-
136
-
137
-
138
-
139
-
140
-
141
-
142
-
143
-
144
-
145
-
146
-
147
-
148
-
149
-
150
-
151
-
152
-
153
-
154
-
155
-
156
-
157
-
158
-
159
-
160
-
161
-
162
-
163
-
164
-
165
-
166
-
167
-
168
-
169
-
170
-
171
-
172
-
173
-
174
-
175
-
176
-
177
-
178
-
179
-
180
-
181
-
182
-
183
-
184
-
185
-
186
-
187
-
188
-
189
-
190
-
191
-
192
-
193
-
194
-
195
-
196
-
197
-
198
-
199
-
200
-
201
-
202
-
203
-
204
-
205
-
206
-
207
-
208
-
209
-
210
-
211
-
212
-
213
-
214
-
215
-
216
-
217
-
218
-
219
-
220
-
221
-
222
-
223
-
224
-
225
-
226
-
227
-
228
-
229
-
230
-
231
-
232
-
233
-
234
-
235
-
236
-
237
-
238
-
239
-
240
-
241
-
242
-
243
-
244
-
245
-
246
-
247
-
248
-
249
-
250
-
251
-
252
-
253
-
254
-
255
-
256
-
257
-
258
-
259
-
260
-
261
-
262
-
263
-
264
-
265
-
266
-
267
-
268
-
269
-
270
-
271
-
272
-
273
-
274
-
275
-
276
-
277
-
278
-
279
-
280
-
281
-
282
-
283
-
284
-
285
-
286
-
287
-
288
-
289
-
290
-
291
-
292
-
293
-
294
-
295
-
296
-
297
-
298
-
299
-
300
-
301
-
302
-
303
-
304
-
305
-
306
-
307
-
308
-
309
-
310
-
311
-
312
-
313
-
314
-
315
-
316
-
317
-
318
-
319
-
320
-
321
-
322
-
323
-
324
-
325
-
326
-
327
-
328
-
329
-
330
-
331
-
332
-
333
-
334
-
335
-
336
-
337
-
338
-
339
-
340
-
341
-
342
-
343
-
344
-
345
-
346
-
347
-
348
-
349
-
350
-
351
-
352
-
353
-
354
-
355
-
356
-
357
-
358
-
359
-
360
-
361
-
362
-
363
-
364
-
365
-
366
-
367
-
368
-
369
-
370
-
371
-
372
-
373
-
374
-
375
-
376
-
377
-
378
-
379
-
380
-
381
-
382
-
383
-
384
-
385
-
386
-
387
-
388
-
389
-
390
-
391
-
392
-
393
-
394
-
395
-
396
 |
 |

19
Overview Operating & Financial Review Governance Financial Statements Shareholder Information
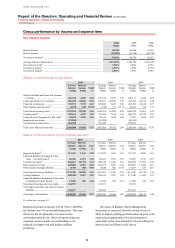
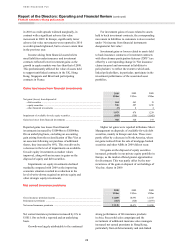
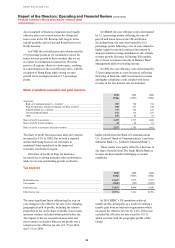
The fall in income from interest-earning assets
was driven by declining yields on loans and
advances to customers following the Group’s
decision to reposition the lending portfolio towards
higher quality assets. Higher yielding unsecured
lending balances decreased, particularly in North
America, where the run-off portfolios continued to
diminish and credit card balances fell as the number
of active accounts declined and repayments by
customers increased. Certain higher risk portfolios
were also managed down in Latin America, Asia and
the Middle East. This reduction was partly offset by
commercial lending growth in CMB and GB&M,
and growth in secured lending in the UK in
residential mortgages.
The interest expense on debt issued by the
Group fell, largely due to a decline in average
balances in debt securities in issue as HSBC
Finance’s funding requirements continued to
decrease in line with the run-off of the residual
balances in Mortgage Services and Consumer
Lending and the sale of the vehicle finance
portfolios.
Net interest income includes the expense of the
internal funding of trading assets, while related
revenue is reported in trading income. The cost of
funding these assets declined as a result of the low
interest rates. In reporting our customer group
results, this cost is included within net trading
income.
Net interest spread decreased due to lower
yields on loans and advances to customers, partly as
a result of the greater focus on secured lending. In
addition, returns on financial investments and
deposit spreads remained constrained due to low
interest rates. Our net interest margin fell by a lesser
amount due to the benefit from an increase in net
free funds as customers held more funds in liquid
non-interest bearing current accounts in the current
low interest rate environment.
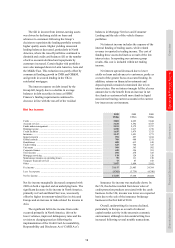
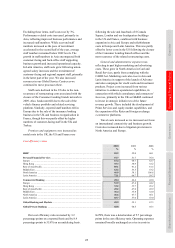
Net fee income
2010
US$m
2009
US$m
2008
US$m
Cards ........................................................................................................................... 3,801 4,625 5,844
Account services ......................................................................................................... 3,632 3,592 4,353
Funds under management ........................................................................................... 2,511 2,172 2,757
Broking income .......................................................................................................... 1,789 1,617 1,738
Credit facilities ........................................................................................................... 1,635 1,479 1,313
Insurance ..................................................................................................................... 1,147 1,421 1,771
Imports/exports ........................................................................................................... 991 897 1,014
Global custody ............................................................................................................ 700 988 1,311
Remittances ................................................................................................................ 680 613 610
Underwriting ............................................................................................................... 623 746 325
Unit trusts ................................................................................................................... 560 363 502
Corporate finance ....................................................................................................... 440 396 381
Trust income ............................................................................................................... 291 278 325
Mortgage servicing ..................................................................................................... 118 124 120
Maintenance income on operating leases ................................................................... 99 111 130
Taxpayer financial services ........................................................................................ 73 87 168
Other ........................................................................................................................... 2,027 1,894 2,102
Fee income .................................................................................................................. 21,117 21,403 24,764
Less: fee expense ........................................................................................................ (3,762) (3,739) (4,740)
Net fee income ............................................................................................................ 17,355 17,664 20,024
Net fee income marginally decreased compared with
2009 on both a reported and an underlying basis. The
significant decrease in fee income in North America,
primarily in Card and Retail Services, was mostly
offset by higher investment-related fees in Asia and
Europe and an increase in trade-related fee income in
Asia.
The significant fall in fee income from cards
occurred primarily in North America, driven by
lower volumes, improved delinquency rates and the
revision to charging practices following the
implementation of the Credit Card Accountability,
Responsibility and Disclosure Act (‘CARD Act’).
Insurance fee income was markedly down. In
the US, the decline resulted from lower sales of
credit protection products associated with the cards
business. In the UK, income was lower on a reported
basis due to the sale of the insurance brokerage
business in the first half of 2010.
Overall, underwriting fee income declined,
particularly in Europe as a result of reduced
capital market activity in the uncertain economic
environment, although in Asia underwriting fees
increased following several notable transactions.