HSBC 2010 Annual Report Download - page 335
Download and view the complete annual report
Please find page 335 of the 2010 HSBC annual report below. You can navigate through the pages in the report by either clicking on the pages listed below, or by using the keyword search tool below to find specific information within the annual report.-
 1
1 -
2
-
3
-
4
-
5
-
6
-
7
-
8
-
9
-
10
-
11
-
12
-
13
-
14
-
15
-
16
-
17
-
18
-
19
-
20
-
21
-
22
-
23
-
24
-
25
-
26
-
27
-
28
-
29
-
30
-
31
-
32
-
33
-
34
-
35
-
36
-
37
-
38
-
39
-
40
-
41
-
42
-
43
-
44
-
45
-
46
-
47
-
48
-
49
-
50
-
51
-
52
-
53
-
54
-
55
-
56
-
57
-
58
-
59
-
60
-
61
-
62
-
63
-
64
-
65
-
66
-
67
-
68
-
69
-
70
-
71
-
72
-
73
-
74
-
75
-
76
-
77
-
78
-
79
-
80
-
81
-
82
-
83
-
84
-
85
-
86
-
87
-
88
-
89
-
90
-
91
-
92
-
93
-
94
-
95
-
96
-
97
-
98
-
99
-
100
-
101
-
102
-
103
-
104
-
105
-
106
-
107
-
108
-
109
-
110
-
111
-
112
-
113
-
114
-
115
-
116
-
117
-
118
-
119
-
120
-
121
-
122
-
123
-
124
-
125
-
126
-
127
-
128
-
129
-
130
-
131
-
132
-
133
-
134
-
135
-
136
-
137
-
138
-
139
-
140
-
141
-
142
-
143
-
144
-
145
-
146
-
147
-
148
-
149
-
150
-
151
-
152
-
153
-
154
-
155
-
156
-
157
-
158
-
159
-
160
-
161
-
162
-
163
-
164
-
165
-
166
-
167
-
168
-
169
-
170
-
171
-
172
-
173
-
174
-
175
-
176
-
177
-
178
-
179
-
180
-
181
-
182
-
183
-
184
-
185
-
186
-
187
-
188
-
189
-
190
-
191
-
192
-
193
-
194
-
195
-
196
-
197
-
198
-
199
-
200
-
201
-
202
-
203
-
204
-
205
-
206
-
207
-
208
-
209
-
210
-
211
-
212
-
213
-
214
-
215
-
216
-
217
-
218
-
219
-
220
-
221
-
222
-
223
-
224
-
225
-
226
-
227
-
228
-
229
-
230
-
231
-
232
-
233
-
234
-
235
-
236
-
237
-
238
-
239
-
240
-
241
-
242
-
243
-
244
-
245
-
246
-
247
-
248
-
249
-
250
-
251
-
252
-
253
-
254
-
255
-
256
-
257
-
258
-
259
-
260
-
261
-
262
-
263
-
264
-
265
-
266
-
267
-
268
-
269
-
270
-
271
-
272
-
273
-
274
-
275
-
276
-
277
-
278
-
279
-
280
-
281
-
282
-
283
-
284
-
285
-
286
-
287
-
288
-
289
-
290
-
291
-
292
-
293
-
294
-
295
-
296
-
297
-
298
-
299
-
300
-
301
-
302
-
303
-
304
-
305
-
306
-
307
-
308
-
309
-
310
-
311
-
312
-
313
-
314
-
315
-
316
-
317
-
318
-
319
-
320
-
321
-
322
-
323
-
324
-
 325
325 -
 326
326 -
 327
327 -
 328
328 -
 329
329 -
 330
330 -
 331
331 -
 332
332 -
 333
333 -
 334
334 -
 335
335 -
 336
336 -
 337
337 -
 338
338 -
 339
339 -
 340
340 -
 341
341 -
 342
342 -
 343
343 -
 344
344 -
 345
345 -
346
-
347
-
348
-
349
-
350
-
351
-
352
-
353
-
354
-
355
-
356
-
357
-
358
-
359
-
360
-
361
-
362
-
363
-
364
-
365
-
366
-
367
-
368
-
369
-
370
-
371
-
372
-
373
-
374
-
375
-
376
-
377
-
378
-
379
-
380
-
381
-
382
-
383
-
384
-
385
-
386
-
387
-
388
-
389
-
390
-
391
-
392
-
393
-
394
-
395
-
396
 |
 |

333
Overview Operating & Financial Review Governance Financial Statements Shareholder Information
Europe
Hong
Kong
Rest of
Asia-
Pacific
Middle
East
North
America
Latin
America Total
US$m US$m US$m US$m US$m US$m US$m
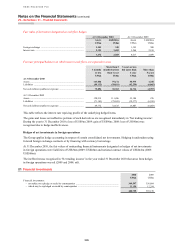
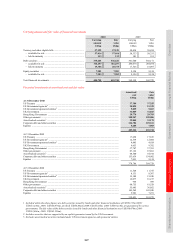
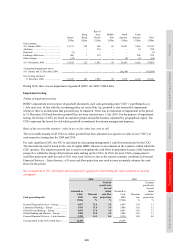
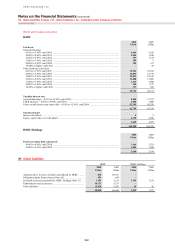
Gross amount
At 1 January 2009 ................................. 15,511 122 364 69 12,487 3,866 32,419
Additions .............................................. – – 570 – – 10 580
Disposals ............................................... (3) – – – – – (3)
Exchange differences ............................ 460 1 119 – – 294 874
Other changes ....................................... (53) – – – (4) (8) (65)
At 31 December 2009 ........................... 15,915 123 1,053 69 12,483 4,162 33,805
Accumulated impairment losses
At 1 January and 31 December 2009 ... – – – – (10,564) – (10,564)
Net carrying amount at
31 December 2009 ........................... 15,915 123 1,053 69 1,919 4,162 23,241
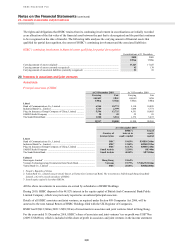
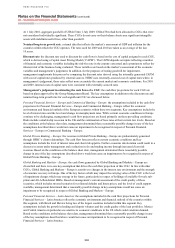
During 2010, there was no impairment of goodwill (2009: nil; 2008: US$10.6bn).
Impairment testing
Timing of impairment testing
HSBC’s impairment test in respect of goodwill allocated to each cash-generating unit (‘CGU’) is performed as at
1 July each year. In line with the accounting policy set out in Note 2p, goodwill is also retested for impairment
whenever there is an indication that goodwill may be impaired. There was no indication of impairment in the period
to 31 December 2010 and therefore goodwill has not been retested since 1 July 2010. For the purpose of impairment
testing, the Group’s CGUs are based on customer groups and global business separated by geographical region. The
CGUs represent the lowest level at which goodwill is monitored for internal management purposes.
Basis of the recoverable amount – value in use or fair value less costs to sell
The recoverable amount of all CGUs to which goodwill has been allocated was equal to its value in use (‘VIU’) at
each respective testing date for 2009 and 2010.
For each significant CGU, the VIU is calculated by discounting management’s cash flow projections for the CGU.
The discount rate used is based on the cost of capital HSBC allocates to investments in the countries within which the
CGU operates. The long-term growth rate is used to extrapolate the cash flows in perpetuity because of the long-term
perspective within the Group of the business units making up the CGUs. In 2010, for most CGUs, management’s
cash flow projections until the end of 2011 were used. However, due to the current economic conditions in Personal
Financial Services – Latin America, a 10-year cash flow projection was used to more accurately estimate the cash
flows for the period.
Key assumptions in VIU calculation and management’s approach to determining the values assigned to each key
assumption
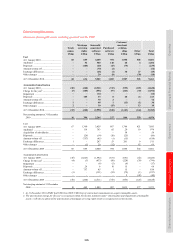
2010 2009
Cash-generating unit
Goodwill at
1 July
2010
Discount
rate
Nominal
growth rate
beyond
initial
cash flow
projections
Goodwill at
1 July
2009
Discount
rate
Nominal
growth rate
beyond
initial
cash flow
projections
US$m % % US$m % %
Personal Financial Services – Europe ............. 4,017 11.0 3.0 4,507 11.0 3.1
Commercial Banking – Europe ....................... 3,015 11.0 3.0 3,480 11.0 3.1
Global Private Banking – Europe .................... 4,055 11.0 3.0 4,483 11.0 3.1
Global Banking and Markets – Europe ........... 2,983 12.0 3.0 3,489 11.0 3.1
Personal Financial Services – Latin America .. 2,385 14.3 8.6 2,350 15.0 8.0
Total goodwill in the CGUs listed above ........ 16,455 18,309