HSBC 2010 Annual Report Download - page 241
Download and view the complete annual report
Please find page 241 of the 2010 HSBC annual report below. You can navigate through the pages in the report by either clicking on the pages listed below, or by using the keyword search tool below to find specific information within the annual report.-
 1
1 -
2
-
3
-
4
-
5
-
6
-
7
-
8
-
9
-
10
-
11
-
12
-
13
-
14
-
15
-
16
-
17
-
18
-
19
-
20
-
21
-
22
-
23
-
24
-
25
-
26
-
27
-
28
-
29
-
30
-
31
-
32
-
33
-
34
-
35
-
36
-
37
-
38
-
39
-
40
-
41
-
42
-
43
-
44
-
45
-
46
-
47
-
48
-
49
-
50
-
51
-
52
-
53
-
54
-
55
-
56
-
57
-
58
-
59
-
60
-
61
-
62
-
63
-
64
-
65
-
66
-
67
-
68
-
69
-
70
-
71
-
72
-
73
-
74
-
75
-
76
-
77
-
78
-
79
-
80
-
81
-
82
-
83
-
84
-
85
-
86
-
87
-
88
-
89
-
90
-
91
-
92
-
93
-
94
-
95
-
96
-
97
-
98
-
99
-
100
-
101
-
102
-
103
-
104
-
105
-
106
-
107
-
108
-
109
-
110
-
111
-
112
-
113
-
114
-
115
-
116
-
117
-
118
-
119
-
120
-
121
-
122
-
123
-
124
-
125
-
126
-
127
-
128
-
129
-
130
-
131
-
132
-
133
-
134
-
135
-
136
-
137
-
138
-
139
-
140
-
141
-
142
-
143
-
144
-
145
-
146
-
147
-
148
-
149
-
150
-
151
-
152
-
153
-
154
-
155
-
156
-
157
-
158
-
159
-
160
-
161
-
162
-
163
-
164
-
165
-
166
-
167
-
168
-
169
-
170
-
171
-
172
-
173
-
174
-
175
-
176
-
177
-
178
-
179
-
180
-
181
-
182
-
183
-
184
-
185
-
186
-
187
-
188
-
189
-
190
-
191
-
192
-
193
-
194
-
195
-
196
-
197
-
198
-
199
-
200
-
201
-
202
-
203
-
204
-
205
-
206
-
207
-
208
-
209
-
210
-
211
-
212
-
213
-
214
-
215
-
216
-
217
-
218
-
219
-
220
-
221
-
222
-
223
-
224
-
225
-
226
-
227
-
228
-
229
-
230
-
 231
231 -
 232
232 -
 233
233 -
 234
234 -
 235
235 -
 236
236 -
 237
237 -
 238
238 -
 239
239 -
 240
240 -
 241
241 -
 242
242 -
 243
243 -
 244
244 -
 245
245 -
 246
246 -
 247
247 -
 248
248 -
 249
249 -
 250
250 -
 251
251 -
252
-
253
-
254
-
255
-
256
-
257
-
258
-
259
-
260
-
261
-
262
-
263
-
264
-
265
-
266
-
267
-
268
-
269
-
270
-
271
-
272
-
273
-
274
-
275
-
276
-
277
-
278
-
279
-
280
-
281
-
282
-
283
-
284
-
285
-
286
-
287
-
288
-
289
-
290
-
291
-
292
-
293
-
294
-
295
-
296
-
297
-
298
-
299
-
300
-
301
-
302
-
303
-
304
-
305
-
306
-
307
-
308
-
309
-
310
-
311
-
312
-
313
-
314
-
315
-
316
-
317
-
318
-
319
-
320
-
321
-
322
-
323
-
324
-
325
-
326
-
327
-
328
-
329
-
330
-
331
-
332
-
333
-
334
-
335
-
336
-
337
-
338
-
339
-
340
-
341
-
342
-
343
-
344
-
345
-
346
-
347
-
348
-
349
-
350
-
351
-
352
-
353
-
354
-
355
-
356
-
357
-
358
-
359
-
360
-
361
-
362
-
363
-
364
-
365
-
366
-
367
-
368
-
369
-
370
-
371
-
372
-
373
-
374
-
375
-
376
-
377
-
378
-
379
-
380
-
381
-
382
-
383
-
384
-
385
-
386
-
387
-
388
-
389
-
390
-
391
-
392
-
393
-
394
-
395
-
396
 |
 |

239
Overview Operating & Financial Review Governance Financial Statements Shareholder Information
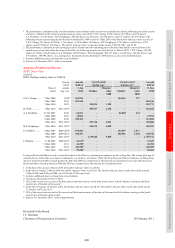
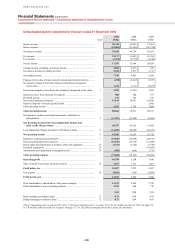
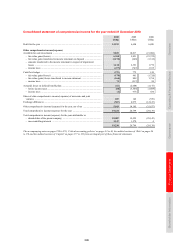
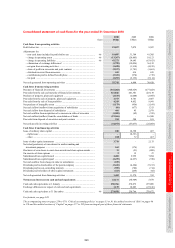
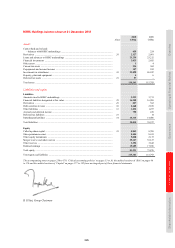
Consolidated statement of comprehensive income for the year ended 31 December 2010
2010 2009 2008
US$m US$m US$m
Profit for the year ........................................................................................................ 14,191 6,694 6,498
Other comprehensive income/(expense)
Available-for-sale investments ................................................................................... 5,835 10,817 (21,904)
– fair value gains/(losses) ...................................................................................... 6,368 9,821 (23,722)
– fair value gains transferred to income statement on disposal ............................ (1,174) (648) (1,316)
– amounts transferred to the income statement in respect of impairment
losses .................................................................................................................. 1,118 2,391 1,779
– income taxes ....................................................................................................... (477) (747) 1,355
Cash flow hedges ........................................................................................................ (271) 772 124
– fair value gains/(losses) ...................................................................................... (178) 481 (1,720)
– fair value (gains)/losses transferred to income statement .................................. (164) 808 1,754
– income taxes ....................................................................................................... 71 (517) 90
Actuarial losses on defined benefit plans ................................................................... (61) (2,608) (1,175)
– before income taxes ............................................................................................ (60) (3,586) (1,609)
– income taxes ....................................................................................................... (1) 978 434
Share of other comprehensive income/(expense) of associates and joint
ventures .................................................................................................................. 107 149 (559)
Exchange differences .................................................................................................. (567) 4,975 (12,123)
Other comprehensive income/(expense) for the year, net of tax ............................... 5,043 14,105 (35,637)
Total comprehensive income/(expense) for the year ................................................. 19,234 20,799 (29,139)
Total comprehensive income/(expense) for the year attributable to:
– shareholders of the parent company .................................................................. 18,087 19,529 (29,143)
– non-controlling interests .................................................................................... 1,147 1,270 4
19,234 20,799 (29,139)
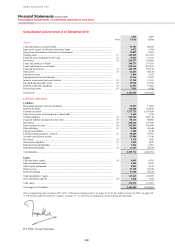
The accompanying notes on pages 250 to 370, ‘Critical accounting policies’ on pages 33 to 36, the audited sections of ‘Risk’ on pages 86
to 176 and the audited sections of ‘Capital’ on pages 177 to 182 form an integral part of these financial statements.