HSBC 2010 Annual Report Download - page 82
Download and view the complete annual report
Please find page 82 of the 2010 HSBC annual report below. You can navigate through the pages in the report by either clicking on the pages listed below, or by using the keyword search tool below to find specific information within the annual report.-
 1
1 -
2
-
3
-
4
-
5
-
6
-
7
-
8
-
9
-
10
-
11
-
12
-
13
-
14
-
15
-
16
-
17
-
18
-
19
-
20
-
21
-
22
-
23
-
24
-
25
-
26
-
27
-
28
-
29
-
30
-
31
-
32
-
33
-
34
-
35
-
36
-
37
-
38
-
39
-
40
-
41
-
42
-
43
-
44
-
45
-
46
-
47
-
48
-
49
-
50
-
51
-
52
-
53
-
54
-
55
-
56
-
57
-
58
-
59
-
60
-
61
-
62
-
63
-
64
-
65
-
66
-
67
-
68
-
69
-
70
-
71
-
 72
72 -
 73
73 -
 74
74 -
 75
75 -
 76
76 -
 77
77 -
 78
78 -
 79
79 -
 80
80 -
 81
81 -
 82
82 -
 83
83 -
 84
84 -
 85
85 -
 86
86 -
 87
87 -
 88
88 -
 89
89 -
 90
90 -
 91
91 -
 92
92 -
93
-
94
-
95
-
96
-
97
-
98
-
99
-
100
-
101
-
102
-
103
-
104
-
105
-
106
-
107
-
108
-
109
-
110
-
111
-
112
-
113
-
114
-
115
-
116
-
117
-
118
-
119
-
120
-
121
-
122
-
123
-
124
-
125
-
126
-
127
-
128
-
129
-
130
-
131
-
132
-
133
-
134
-
135
-
136
-
137
-
138
-
139
-
140
-
141
-
142
-
143
-
144
-
145
-
146
-
147
-
148
-
149
-
150
-
151
-
152
-
153
-
154
-
155
-
156
-
157
-
158
-
159
-
160
-
161
-
162
-
163
-
164
-
165
-
166
-
167
-
168
-
169
-
170
-
171
-
172
-
173
-
174
-
175
-
176
-
177
-
178
-
179
-
180
-
181
-
182
-
183
-
184
-
185
-
186
-
187
-
188
-
189
-
190
-
191
-
192
-
193
-
194
-
195
-
196
-
197
-
198
-
199
-
200
-
201
-
202
-
203
-
204
-
205
-
206
-
207
-
208
-
209
-
210
-
211
-
212
-
213
-
214
-
215
-
216
-
217
-
218
-
219
-
220
-
221
-
222
-
223
-
224
-
225
-
226
-
227
-
228
-
229
-
230
-
231
-
232
-
233
-
234
-
235
-
236
-
237
-
238
-
239
-
240
-
241
-
242
-
243
-
244
-
245
-
246
-
247
-
248
-
249
-
250
-
251
-
252
-
253
-
254
-
255
-
256
-
257
-
258
-
259
-
260
-
261
-
262
-
263
-
264
-
265
-
266
-
267
-
268
-
269
-
270
-
271
-
272
-
273
-
274
-
275
-
276
-
277
-
278
-
279
-
280
-
281
-
282
-
283
-
284
-
285
-
286
-
287
-
288
-
289
-
290
-
291
-
292
-
293
-
294
-
295
-
296
-
297
-
298
-
299
-
300
-
301
-
302
-
303
-
304
-
305
-
306
-
307
-
308
-
309
-
310
-
311
-
312
-
313
-
314
-
315
-
316
-
317
-
318
-
319
-
320
-
321
-
322
-
323
-
324
-
325
-
326
-
327
-
328
-
329
-
330
-
331
-
332
-
333
-
334
-
335
-
336
-
337
-
338
-
339
-
340
-
341
-
342
-
343
-
344
-
345
-
346
-
347
-
348
-
349
-
350
-
351
-
352
-
353
-
354
-
355
-
356
-
357
-
358
-
359
-
360
-
361
-
362
-
363
-
364
-
365
-
366
-
367
-
368
-
369
-
370
-
371
-
372
-
373
-
374
-
375
-
376
-
377
-
378
-
379
-
380
-
381
-
382
-
383
-
384
-
385
-
386
-
387
-
388
-
389
-
390
-
391
-
392
-
393
-
394
-
395
-
396
 |
 |

HSBC HOLDINGS PLC
Report of the Directors: Operating and Financial Review (continued)
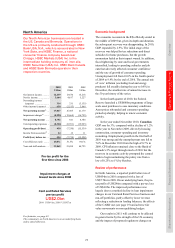
Geographical regions > Latin America // Other information > FUM and assets in custody / Property
80
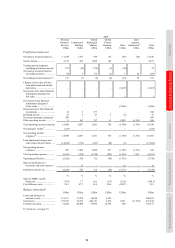
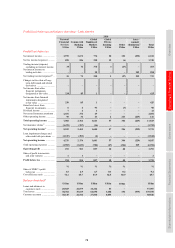
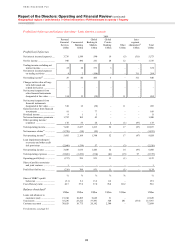
Profit/(loss) before tax and balance sheet data – Latin America (continued)
2009
Personal
Financial
Services
US$m
Commercial
Banking
US$m
Global
Banking &
Markets
US$m
Global
Private
Banking
US$m
Other
US$m
Inter-
segment
elimination56
US$m
Total
US$m
Profit/(loss) before tax
Net interest income/(expense) .... 3,736 1,544 590 19 (5) (311) 5,573
Net fee income ............................ 948 490 251 28 12 – 1,729
Trading income excluding net
interest income ....................... 25 38 573 3 – – 639
Net interest income/(expense)
on trading activities ................ 4 2 (108) – – 311 209
Net trading income49 ................... 29 40 465 3 – 311 848
Changes in fair value of long-
term debt issued and
related derivatives .................. – – – – – – –
Net income/(expense) from
other financial instruments
designated at fair value ........... 510 12 (38) – 11 – 495
Net income/(expense) from
financial instruments
designated at fair value ........... 510 12 (38) – 11 – 495
Gains less losses from financial
investments ............................. 91 – 77 – – – 168
Dividend income ......................... 9 1 1 – – – 11
Net earned insurance premiums . 1,752 105 43 – – – 1,900
Other operating income/
(expense) ................................ 170 35 24 2 (1) (97) 133
Total operating income ............... 7,245 2,227 1,413 52 17 (97) 10,857
Net insurance claims57 ................ (1,750) (58) (25) – – – (1,833)
Net operating income46 ............... 5,495 2,169 1,388 52 17 (97) 9,024
Loan impairment (charges)/
recoveries and other credit
risk provisions ........................ (2,046) (534) 57 – (3) – (2,526)
Net operating income ................. 3,449 1,635 1,445 52 14 (97) 6,498
Total operating expenses ............ (3,666) (1,236) (514) (41) (15) 97 (5,375)
Operating profit/(loss) ................ (217) 399 931 11 (1) – 1,123
Share of profit in associates
and joint ventures ................... 1 – – – – – 1
Profit/(loss) before tax ................ (216) 399 931 11 (1) – 1,124
% % % % % %
Share of HSBC’s profit
before tax ................................ (3.1) 5.6 13.2 0.2 – 15.9
Cost efficiency ratio ................... 66.7 57.0 37.0 78.8 88.2 59.6
Balance sheet data45
US$m US$m US$m US$m US$m US$m
Loans and advances to
customers (net) ....................... 19,748 18,205 9,645 31 – 47,629
Total assets ................................. 35,236 23,212 57,491 328 281 (581) 115,967
Customer accounts ...................... 30,628 19,775 20,142 2,344 – 72,889
For footnotes, see page 83.